PiHole unresponsive after update to 6.0 extreme high CPU usage

Hello everyone. I recently upgraded Pi-hole to version 6.0.4. I also started using groups and client. Specifically to block all DNS requests except specific ones for a network.

The issue I am facing:
Very high CPU usage with completely unresponsive DNS and/or web interface.

Details about my system:
LXC Debian Image 3 cores, 512MB RAM on Proxmox Intel n100

What I have changed since installing Pi-hole:
I've changed Pi-hole to use opnsense unbound as dns upstream, added blocklists with a total of 4.000.000 and changed to listen on eth interface.
Pi-hole was running fine for weeks in this config and before that for years on before that on a raspi 3b with unbound running on the same machine.

As described earlier i also started to use groups and clients. Mainly to block all dns with regex .* with whitelisting for a network.

I'd be happy to provide logs for further investigation.
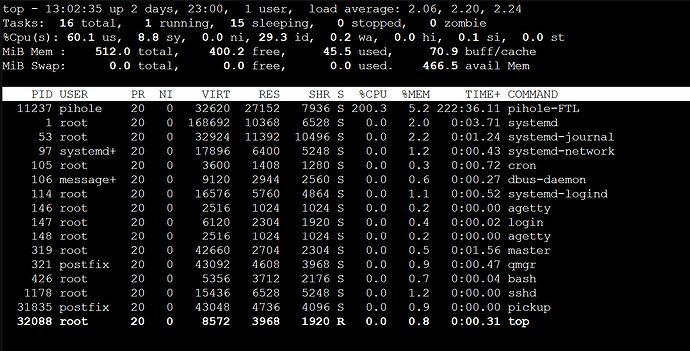
Attached a screenshot Pi-hole container top

Another problem I saw was the memory usage when updating gravity. Usually 256mb of ram was completely fine with the same amount of domains on the blocklist, but now I had to bump the ram to 512mb...
1 Like

Debug log: https://tricorder.pi-hole.net/QJQGLrWl/

Your debug log is not valid.
Can you please provide a new one?

Same issue here. Running on a Raspi 3B, stable for years. I did a fresh install of my whole system with latest RaspberryOS Bookworm and installed unbound, hyperlocal and some tiny helpers. I have only a small home network running about 1-2 queries per second. I already updated pihole today, but the issues still occurs. The DNS Server is absolutely unresponsive. The webinterface works perfect, no issues there. Unbound works without problems using dig whatever.tld @127.0.0.1 -p 5353.

Debug log: https://tricorder.pi-hole.net/yIvUCGwR/

1 Like

Core 6.0.5 just came out Pi-hole FTL v6.0.4, Web v6.0.2 and Core v6.0.5 Released! - Announcements - Pi-hole Userspace

As I stated, also happens with todays update.

1 Like

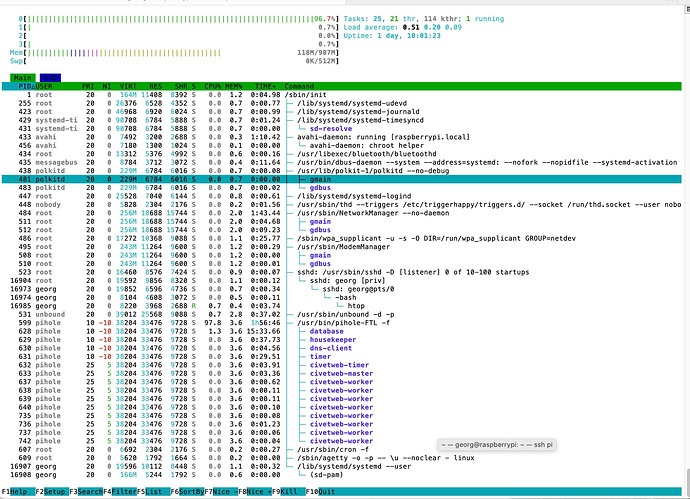
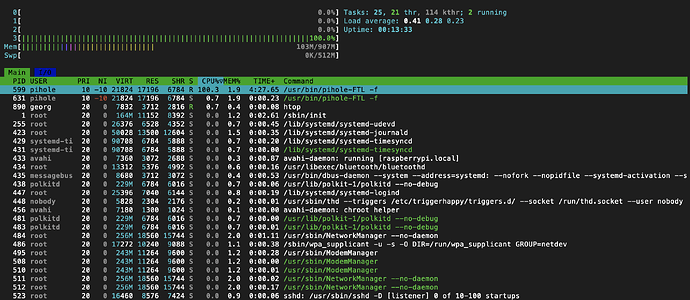
It would be very good if you could enable htop's thread view (F2 -> Display options -> Tree View or F5) and also enable custom thread names to be shown from htop's settings (F2 -> Display options -> Global options -> "Display threads in a different color" and "Show custom thread names") and then provide another screenshot.

This would hopefully help us identifying the culprit here. We already know that this issue exists when the database is broken, i.e., when you see the massive load especially on the database thread, I'd suggest you try

sudo service pihole-FTL stop
mv /etc/pihole/pihole-FTL.db /etc/pihole/pihole-FTL.db.bck
sudo service pihole-FTL start

and see if that resolves the issue.

If you need the data in your long-term database, you can attempt a recovery, however, this is a process that may not always work and might consume a lot of time and disk space in intermediary objects.

pihole-FTL sqlite3 /etc/pihole/pihole-FTL.db.bck ".recover --ignore-freelist" > recovery.sql
pihole-FTL sqlite3 /etc/pihole/pihole-FTL.recovered.db < recovery.sql
rm recovery.sql
1 Like

Here you go, I hope it fits your needs.

I started with a fresh database and the problem instantly reoccured.

Okay, so far, so unclear. Please try

sudo strace -p $(cat /var/run/pihole-FTL.pid)

(you can interrupt it with Ctrl + C) and provide some of the output.

Is it generating output really fast or only a few lines per second (or even less)?

There ist massive and repeating output of the following lines:

pread64(39, "\0\0\0n\0\0007l\0\0\0\0\0\0\0\0", 16, 24) = 16
newfstatat(AT_FDCWD, "/etc/pihole/gravity.db-wal", 0x7fc79f42a0, 0) = -1 ENOENT (No such file or directory)
fstat(39, {st_mode=S_IFREG|0640, st_size=58114048, ...}) = 0
fcntl(39, F_SETLK, {l_type=F_UNLCK, l_whence=SEEK_SET, l_start=0, l_len=0}) = 0
fcntl(39, F_SETLK, {l_type=F_RDLCK, l_whence=SEEK_SET, l_start=1073741824, l_len=1}) = 0
fcntl(39, F_SETLK, {l_type=F_RDLCK, l_whence=SEEK_SET, l_start=1073741826, l_len=510}) = 0
fcntl(39, F_SETLK, {l_type=F_UNLCK, l_whence=SEEK_SET, l_start=1073741824, l_len=1}) = 0

only the last for digits of this 0x7fc79f42a0 are changing.
Every 5 or more seconds you can find:

write(37, "Mar  7 07:23:55 dnsmasq[17063]: "..., 73) = 73
sendmsg(20, {msg_name={sa_family=AF_INET, sin_port=htons(35415), sin_addr=inet_addr("10.0.0.1")}, msg_namelen=16, msg_iov=[{iov_base="\343D\201\200\0\1\0\0\0\1\0\0\5a1806\7dscw154\6akama"..., iov_len=109}], msg_iovlen=1, msg_control=[{cmsg_len=28, cmsg_level=SOL_IP, cmsg_type=IP_PKTINFO, cmsg_data={ipi_ifindex=0, ipi_spec_dst=inet_addr("10.0.0.3"), ipi_addr=inet_addr("0.0.0.0")}}], msg_controllen=32, msg_flags=0}, 0) = 109
ppoll([{fd=19, events=POLLIN}, {fd=20, events=POLLIN}, {fd=21, events=POLLIN}, {fd=22, events=POLLIN}, {fd=23, events=POLLIN}, {fd=24, events=POLLIN}, {fd=25, events=POLLIN}, {fd=43, events=POLLIN}], 8, NULL, NULL, 8) = 1 ([{fd=20, revents=POLLIN}])
recvmsg(20, {msg_name={sa_family=AF_INET, sin_port=htons(35415), sin_addr=inet_addr("10.0.0.1")}, msg_namelen=28 => 16, msg_iov=[{iov_base="U\234\1\0\0\1\0\0\0\0\0\0\16musicstatus-eu\21edge"..., iov_len=1232}], msg_iovlen=1, msg_control=[{cmsg_len=28, cmsg_level=SOL_IP, cmsg_type=IP_PKTINFO, cmsg_data={ipi_ifindex=if_nametoindex("eth0"), ipi_spec_dst=inet_addr("10.0.0.3"), ipi_addr=inet_addr("10.0.0.3")}}], msg_controllen=32, msg_flags=0}, 0) = 65
ioctl(20, SIOCGIFNAME, {ifr_ifindex=2, ifr_name="eth0"}) = 0
getpid()                                = 17063
gettid()                                = 17063
getpid()                                = 17063

which I interpret as the thing which should happen.

This is very bizarre, maybe your gravity is damaged? FTL should not actually be writing to the database at all unless you are using the API to modify lists, domains, etc.

Does a manual run of

sudo pihole -g
sudo pihole restartdns

improve/change the situation for you?

Actually I used the API to recieve pihole data in Homeassistant and pihole remote app. But these don't work since I did a complete fresh install of the whole os and pihole.

Edit:

sudo pihole -g
sudo pihole reloaddns

didn't change the behavior.

2nd Edit:
I uninstalled pihole and started with a complete new instance.
Still the same weird entries with missing files gravity.db-wal and gravity.db-journal

Do you have really high traffic on your Pi-hole? I have never seen such extensive database communication regarding the gravity database before. Seeing a few of them (maybe even up to ten) next to each query is okay but this should definitely not be "massive".

I did just try an strace on my own Pi-hole and see maybe once every 20 seconds about 10 of them. And a lot of "silence" in between.

No. Acutally only one client. If I allow my whole home network (~30 clients) the pihole becomes unresponsive and dns requests time out.

Can you please generate a fresh debug log?

A post was split to a new topic: High CPU use V6.0.5

Here you go:
https://tricorder.pi-hole.net/I1i98k1V/

In the other thread it was stated that the user had no issues with Core 6.0.4.
I am not running pihole in docker, can I install that version in an easy way?

What I'm seeing is the cpu% shown in the web UI is an order of magnitude greater than the actual CPU seen by top or top.

I'm having the exact same issue. High CPU over 200% then when I disabled blocking it went down to 100%

1 Like

Stupid question, but:
Can you reproduce if you have domains blocked and at the same time on an allowlist, e.g. just add a list as block and allow list at the same time?