To confirm with you, the deployment was not in docker on my end.
I reverted to a backup (6.0.4) and things have been stable ever since.
Waiting to hear back if there is a bug fix, version update, etc. to remedy the concern of high CPU on 6.0.5.
To confirm with you, the deployment was not in docker on my end.
I reverted to a backup (6.0.4) and things have been stable ever since.
Waiting to hear back if there is a bug fix, version update, etc. to remedy the concern of high CPU on 6.0.5.
Not OP but letting others know that the comment i am replying to solved my issue. My "database" thread was hogging all my CPU, and recreating the FTL database solved my issue.
Not entity sure what "database" thread you're referencing. Would it be possible to explain in detail the solution to the concern?
Thanks ![]()
Sure, the deeper explanation is in the comment I replied to, from DL6ER. The Pi-Hole program runs over several threads, and it appears that for some reason the thread monitoring the database was not working with the database properly.
Hello,
Thanks for the follow-up.
Attempted to go back to 6.0.5 and same issues reoccurred (high CPU, can't resolve DNS).
Going to stick with 6.0.4 for now until further updates/fixes come down the pipe.
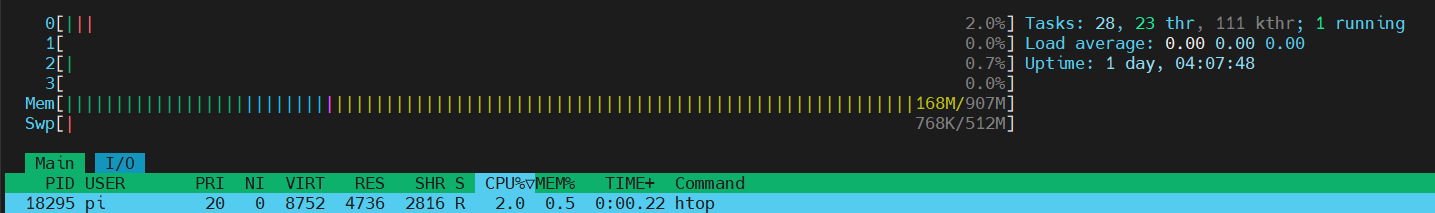
I am having this same issue. Once a day my pihole lxc with 2 cores goes to 50% cpu utilization. Running HTOP shows 1 of the cores is at 100%. Using tree and custom thread names shows that the thread is called civetweb-master with a cpu utilization of 600%.
Here is my debug log: https://tricorder.pi-hole.net/LBnrYPOy/
Exact same concern I ran into. At that time was unable to resolve the concern. Once I downgraded to 6.0.4, everything was back to operational.
Looking forward to hear if you find a fix so I can push back up to 6.0.5 ![]()
Noticed the problem again yesterday. Tried the fix from DL6ER in comment number 6. Worked for about 24 hours. Here I am again with the same problem. I ran the strace command as given in comment 8. My output was nearly identical to that of Osai in comment 9. And the output was seizure inducingly fast. Comment 11 regarding gravity and dns also did not work.
A reboot of the lxc does seem to work for varying amounts of time - sometimes 24 hours, sometimes 3-4 days.
As a potential relevant piece of information - I have identical instances running as proxmox lxc. One is primary and one is secondary. Both are handed out as dns by dhcp on my router. Only the primary experiences this issue - but could also be due to the fact that most of my network traffic uses it.
Both lxcs were created using the same proxmox helper community script and I wonder if that is the same for other people experiencing this issue or if it seems to be independent.
My experience is absolutely exactly the same, but on RPi 3.
I have this issue also, running in docker with latest tag, also tried 2025-03-7 but appears to be the same. I'm running on a Pi3b
I ran pihole -d and got this URL https://tricorder.pi-hole.net/mk0LhfFt/ (for latest and https://tricorder.pi-hole.net/bCUYjDYK/ for 2025-03-7) but am unable to access it myself but I get a white page, the browser (firefox) network inspector tab shows a 403 status code for the page itself and then a bunch of 404 for other requests made.
This appears to have settled down and I'm not noticing any issues at the moment. Will try upgrading again when able
I am seeing the same issue with my RPi.
Debug log: https://tricorder.pi-hole.net/ALMWYt9e/
(before creating the debug, i restarted the pihole-FTL service).
The issue has occured several times now, restarting the pihole-FTL service solved it for another 24hrs - several days.
Same issue is persisting with new Core v6.0.6, Web/FTL v6.1
Still the same civetweb_master process showing high CPU utilization.
Updated to the following version since the initial post/report:
Core v6.0.6
FTL v6.1
Web interface v6.1
The latest version seemed to resolve the CPU concerns
At this time, no father concerns to report.
As noted in the post I am replying to, I had the same problem within 24 hours of upgrading to the most recent update. I rebooted the LXC running Pihole on April 2nd.
The problem has not returned since and I am about an hour away from 5 days uptime. Previously, the problem was about every 24 to 36 hours. So, this is good news. Will continue to monitor.
Unfortunately, the problem has returned, though less frequently. It has happened twice since my last post. First, on April 9 at approximately 17:00 EST (GMT -4:00) and now April 15 at 05:00 EST.
To reiterate, htop shows the single threaded process civetweb-master at 600% utilization. The web-ui is unresponsive. Usually, DNS is still responsive - though if the LXC is not rebooted within a day or so, DNS may stop responding.
While it is frustrating that this problem is persisting without much explanation, the fact that with each update it becomes less frequent makes me think that this bug is secondary to another problem that is actively being worked on. I hope that as V6 continues to mature and be optimized that this problem will be solved within the next few updates.
Here is a fresh debug report if this thread is still being monitored by developers: https://tricorder.pi-hole.net/1nosKP8D/
Regardless, thank you to the developers for the continued hard work improving V6.
*** [ DIAGNOSING ]: Pi-hole diagnosis messages
   count   last timestamp       type                  message                                                       blob1                 blob2                 blob3                 blob4                 blob5
   ------  -------------------  --------------------  ------------------------------------------------------------  --------------------  --------------------  --------------------  --------------------  --------------------
   1       2025-04-15 09:16:54  CONNECTION_ERROR      127.0.0.1#5335                                                TCP connection faile  Connection premature
                                                                                                                    d while receiving pa  ly closed by remote
                                                                                                                    yload length from up  server
                                                                                                                    stream

   1       2025-04-15 06:18:50  LOAD                  excessive load                                                2.00341796875         2

   1       2025-04-14 20:19:19  RATE_LIMIT            172.24.147.180                                                1000                  60                    31

   1       2025-04-15 02:37:19  RATE_LIMIT            172.24.147.33                                                 1000                  60                    31
  2025-04-15 03:09:12.233 EDT [169/T11115] WARNING: API: Bad request (key: bad_request, hint: The API is hosted at pi.hole/api, not pi.hole/admin/api)
   2025-04-15 03:09:12.275 EDT [169/T11115] WARNING: API: Bad request (key: bad_request, hint: The API is hosted at pi.hole/api, not pi.hole/admin/api)
   2025-04-15 03:14:12.233 EDT [169/T11114] WARNING: API: Bad request (key: bad_request, hint: The API is hosted at pi.hole/api, not pi.hole/admin/api)
   2025-04-15 03:14:12.276 EDT [169/T11114] WARNING: API: Bad request (key: bad_request, hint: The API is hosted at pi.hole/api, not pi.hole/admin/api)
   2025-04-15 03:19:12.232 EDT [169/T11113] WARNING: API: Bad request (key: bad_request, hint: The API is hosted at pi.hole/api, not pi.hole/admin/api)
   2025-04-15 03:19:12.274 EDT [169/T11113] WARNING: API: Bad request (key: bad_request, hint: The API is hosted at pi.hole/api, not pi.hole/admin/api)
   2025-04-15 03:24:12.231 EDT [169/T739] WARNING: API: Bad request (key: bad_request, hint: The API is hosted at pi.hole/api, not pi.hole/admin/api)
   2025-04-15 03:24:12.274 EDT [169/T739] WARNING: API: Bad request (key: bad_request, hint: The API is hosted at pi.hole/api, not pi.hole/admin/api)
   2025-04-15 03:29:12.232 EDT [169/T326] WARNING: API: Bad request (key: bad_request, hint: The API is hosted at pi.hole/api, not pi.hole/admin/api)
   2025-04-15 03:29:12.274 EDT [169/T326] WARNING: API: Bad request (key: bad_request, hint: The API is hosted at pi.hole/api, not pi.hole/admin/api)
   2025-04-15 03:34:12.231 EDT [169/T11116] WARNING: API: Bad request (key: bad_request, hint: The API is hosted at pi.hole/api, not pi.hole/admin/api)
   2025-04-15 03:34:12.273 EDT [169/T11116] WARNING: API: Bad request (key: bad_request, hint: The API is hosted at pi.hole/api, not pi.hole/admin/api)
   2025-04-15 03:39:12.230 EDT [169/T327] WARNING: API: Bad request (key: bad_request, hint: The API is hosted at pi.hole/api, not pi.hole/admin/api)
   2025-04-15 03:39:12.273 EDT [169/T327] WARNING: API: Bad request (key: bad_request, hint: The API is hosted at pi.hole/api, not pi.hole/admin/api)
   2025-04-15 03:48:41.300 EDT [35077/F169] WARNING: Connection error (127.0.0.1#5335): TCP connection failed while receiving payload length from upstream (Connection prematurely closed by remote server)
   2025-04-15 04:06:50.925 EDT [35236/F169] WARNING: Connection error (127.0.0.1#5335): TCP connection failed while receiving payload length from upstream (Connection prematurely closed by remote server)
   2025-04-15 04:06:50.930 EDT [35237/F169] WARNING: Connection error (127.0.0.1#5335): TCP connection failed while receiving payload length from upstream (Connection prematurely closed by remote server)
   2025-04-15 04:09:13.323 EDT [35316/F169] WARNING: Connection error (127.0.0.1#5335): TCP connection failed while receiving payload length from upstream (Connection prematurely closed by remote server)
   2025-04-15 04:09:57.203 EDT [35336/F169] WARNING: Connection error (127.0.0.1#5335): TCP connection failed while receiving payload length from upstream (Connection prematurely closed by remote server)
   2025-04-15 05:26:34.026 EDT [35656/F169] WARNING: Connection error (127.0.0.1#5335): TCP connection failed while receiving payload length from upstream (Connection prematurely closed by remote server)
   2025-04-15 06:18:50.277 EDT [169/T317] WARNING: Long-term load (15min avg) larger than number of processors: 2.0 > 2
       [webserver.api.temp]
         limit = 60.000000
         unit = "F" ### CHANGED, default = "C"
Where did you find the directions to add that config snippet?
     headers = [
       "Content-Security-Policy: default-src 'self' 'unsafe-inline';",
       "X-Frame-Options: DENY",
       "X-XSS-Protection: 0",
       "X-Content-Type-Options: nosniff",
       "Referrer-Policy: strict-origin-when-cross-origin"
     ] ### CHANGED, default = [ "X-DNS-Prefetch-Control: off", "Content-Security-Policy: default-src 'self' 'unsafe-inline';", "X-Frame-Options: DENY", "X-XSS-Protection: 0", "X-Content-Type-Options: nosniff", "Referrer-Policy: strict-origin-when-cross-origin" ]
Your domains look a little off as well.
   ----- First 10 Gravity Domains -----
   localhost.localdomain
   localhost.localdomain
   localhost.localdomain
   localhost.localdomain
   localhost.localdomain
   0.0.0.0
   0.0.0.0
   0.0.0.0
   0.0.0.0
   0.0.0.0
Hi! Thanks for the reply.
I don’t know if you were highlighting the temp settings, but that was available in the web ui to change.
I do not know where the web headers originated from. I used the Proxmox Community Scripts to create the LXC - so maybe the issue is with their configuration in their script. I will look it over.
As for those domains - I do use 44 different blocklists. I probably misunderstand how gravity works, but I thought if there was redundancy in some of the domains across lists - gravity updates would filter that out.
Let me know if there is any other information I should provide or if I am understanding things wrong.
Thanks!
Still having the same issues. However, I just implemented some of the recommended changes in recent comments on https://github.com/pi-hole/pi-hole/issues/6061
I will monitor those changes and follow up there so as to consolidate issue tracking.