Pihole + Unbound - not caching DNS [SOLVED] TY Dan & JFB!

Using Pi 3b+
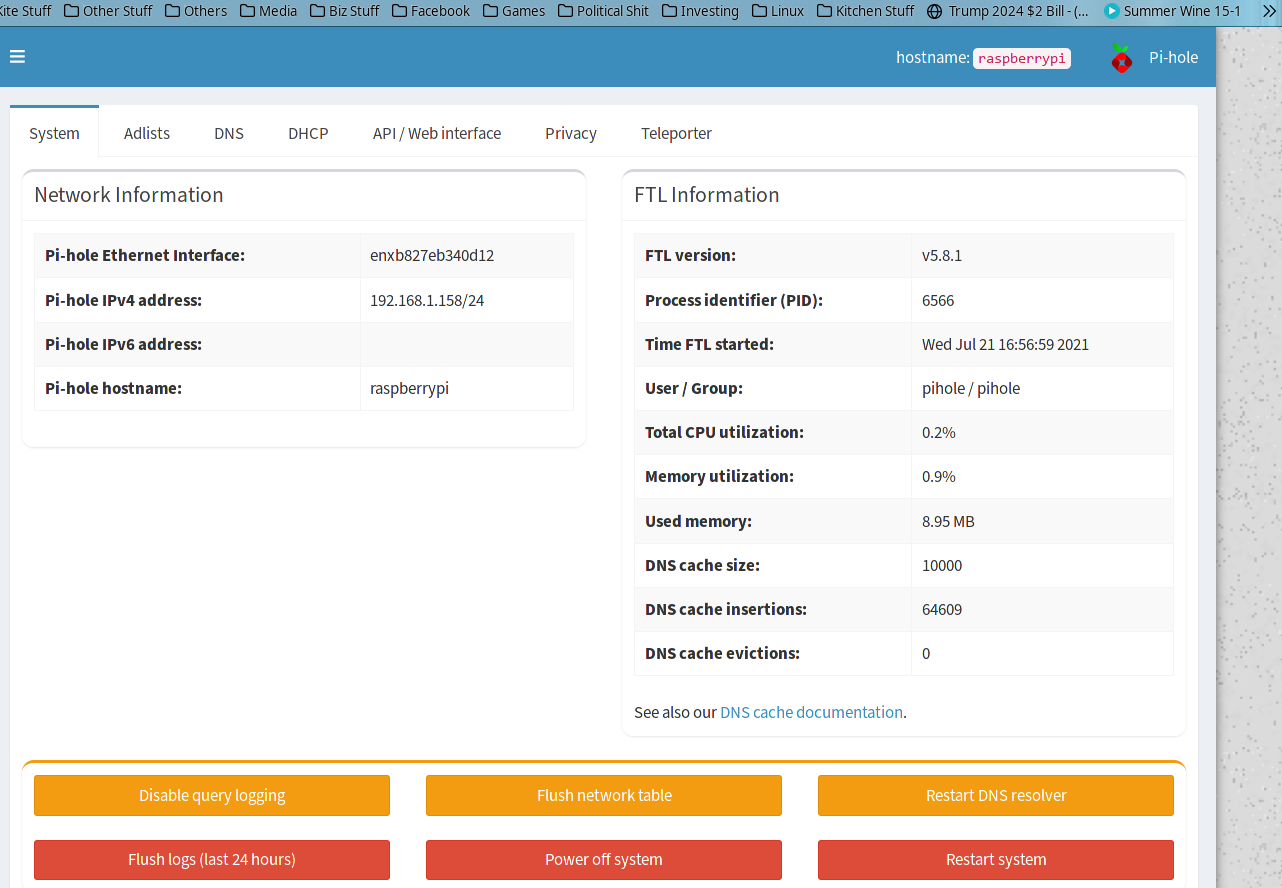
Recent re-install of Pihole (Previous install had Nextcloud installed alongside Pihole, removed Nextcloud to another computer), and added Unbound.

Changed Admin page link to go to port 8080,

Expected Behaviour:

"Status" line on Query Log to show "OK - Cached" (previous install did this) or similar

Actual Behaviour:

"OK (forwarded to localhost#5335)"

Debug Token:

[βœ“] Your debug token is: https://tricorder.pi-hole.net/qiri2jbjz9

Can you post a screenshot of http://pi.hole/admin/settings.php showing the FTL section and the cache population information?

Edit: Your log shows that FTL is caching properly:

   [2021-07-23 07:59:12.394 6566M] Resizing "FTL-domains" from 36864 to (2560 * 16) == 40960 (/dev/shm: 1.9MB used, 484.6MB total, FTL uses 1.9MB)
   [2021-07-23 08:59:01.697 6566M] Resizing "FTL-dns-cache" from 49152 to (3328 * 16) == 53248 (/dev/shm: 1.9MB used, 484.6MB total, FTL uses 1.9MB)

hmm....
ok, but then why is it not showing in the query log?
not trying to be an a$$ - just trying to understand what is going on...

ok, got the screenie for FTL - looking for cache population?

Can you run a few dig or nslookup runs against a single domain and see what is shown for response times and for the web page log?

It's quite possible that the domains you are looking at have very low TTL values and are in the cache for short periods of time. (5 seconds or less for some major sites)

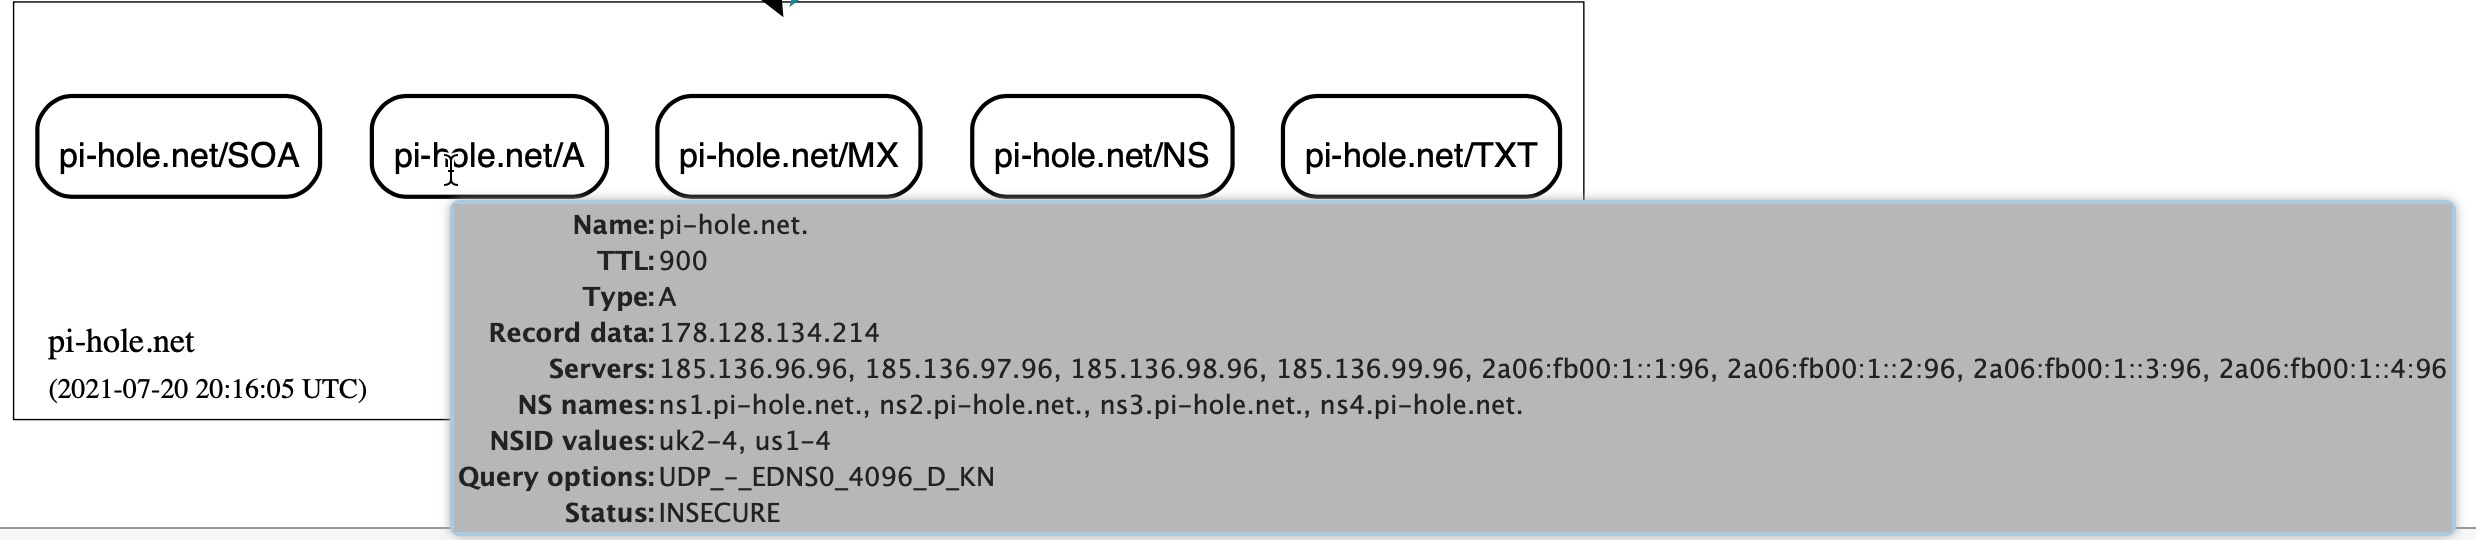
You can try dig pi-hole.net a few times and see if the query response times drop on the additional runs, and then check the web interface to see if the additional ones are coming from cache.

I can run dig on the pi after ssh into it, but oddly, manjaro has no dig or nslookup commands available.
on the r-pi dig shows:

; <<>> DiG 9.11.5-P4-5.1+deb10u5-Raspbian <<>> pi-hole.net
;; global options: +cmd
;; Got answer:
;; ->>HEADER<<- opcode: QUERY, status: NOERROR, id: 35588
;; flags: qr rd ra; QUERY: 1, ANSWER: 1, AUTHORITY: 0, ADDITIONAL: 1

;; OPT PSEUDOSECTION:
; EDNS: version: 0, flags:; udp: 1232
;; QUESTION SECTION:
;pi-hole.net. IN A

;; ANSWER SECTION:
pi-hole.net. 757 IN A 178.128.134.214

;; Query time: 16 msec
;; SERVER: 1.1.1.1#53(1.1.1.1)
;; WHEN: Fri Jul 23 11:57:07 EDT 2021
;; MSG SIZE rcvd: 56

I have to run out for work for a bit - TY VERY MUCH for the help - I should be back in a couple of hours!

:slight_smile:

That's not querying Pi-hole, that's going to your upstream.

If that's the Pi-hole server itself then you can directly query with

dig pi-hole.net @127.0.0.1 or dig pi-hole.net @<PI-HOLE IP>

You need to run it a few times though, the first time it probably will go to unbound and you'll see a query time in maybe 10-100ms. Run dig again and it should show a query time of 1ms or 0ms and that shows it's pulling from cache. Run dig a third time to see even more of this.

After you've done that then check the web interface to see where the queries went, it should just confirm what we've already found out.

A request only shows as cached if at the time of the request, the domain was in cache. Cache entries are typically for 5 minutes or less (the duration of most TTLs). If you have a new request more than the number of seconds specified by the TTL later than the first, the second request won't be in cache and it will be forwarded to the upstream DNS server for resolution. In this case, Pi-hole forwarded it to your local instance of unbound, as expected.

1 Like

so, I ssh'ed into the pi - after about 15 or 16 repeats of the dig command,I get this;

$ dig pi-hole.net

; <<>> DiG 9.11.5-P4-5.1+deb10u5-Raspbian <<>> pi-hole.net
;; global options: +cmd
;; Got answer:
;; ->>HEADER<<- opcode: QUERY, status: NOERROR, id: 15669
;; flags: qr rd ra; QUERY: 1, ANSWER: 1, AUTHORITY: 0, ADDITIONAL: 1

;; OPT PSEUDOSECTION:
; EDNS: version: 0, flags:; udp: 1232
;; QUESTION SECTION:
;pi-hole.net. IN A

;; ANSWER SECTION:
pi-hole.net. 728 IN A 178.128.134.214

;; Query time: 17 msec
;; SERVER: 1.1.1.1#53(1.1.1.1)
;; WHEN: Fri Jul 23 17:43:06 EDT 2021
;; MSG SIZE rcvd: 56

That's not using Pi-hole, that's using your upstream 1.1.1.1

ok - it just seems strange though - before I redid pihole, IIRR almost ALL the requests showed 'cached'...

I thought the reason to use unbound was to keep DNS cache, to speed up subsequent lookups, or am I mistaken?

so, where have I gone wrong?

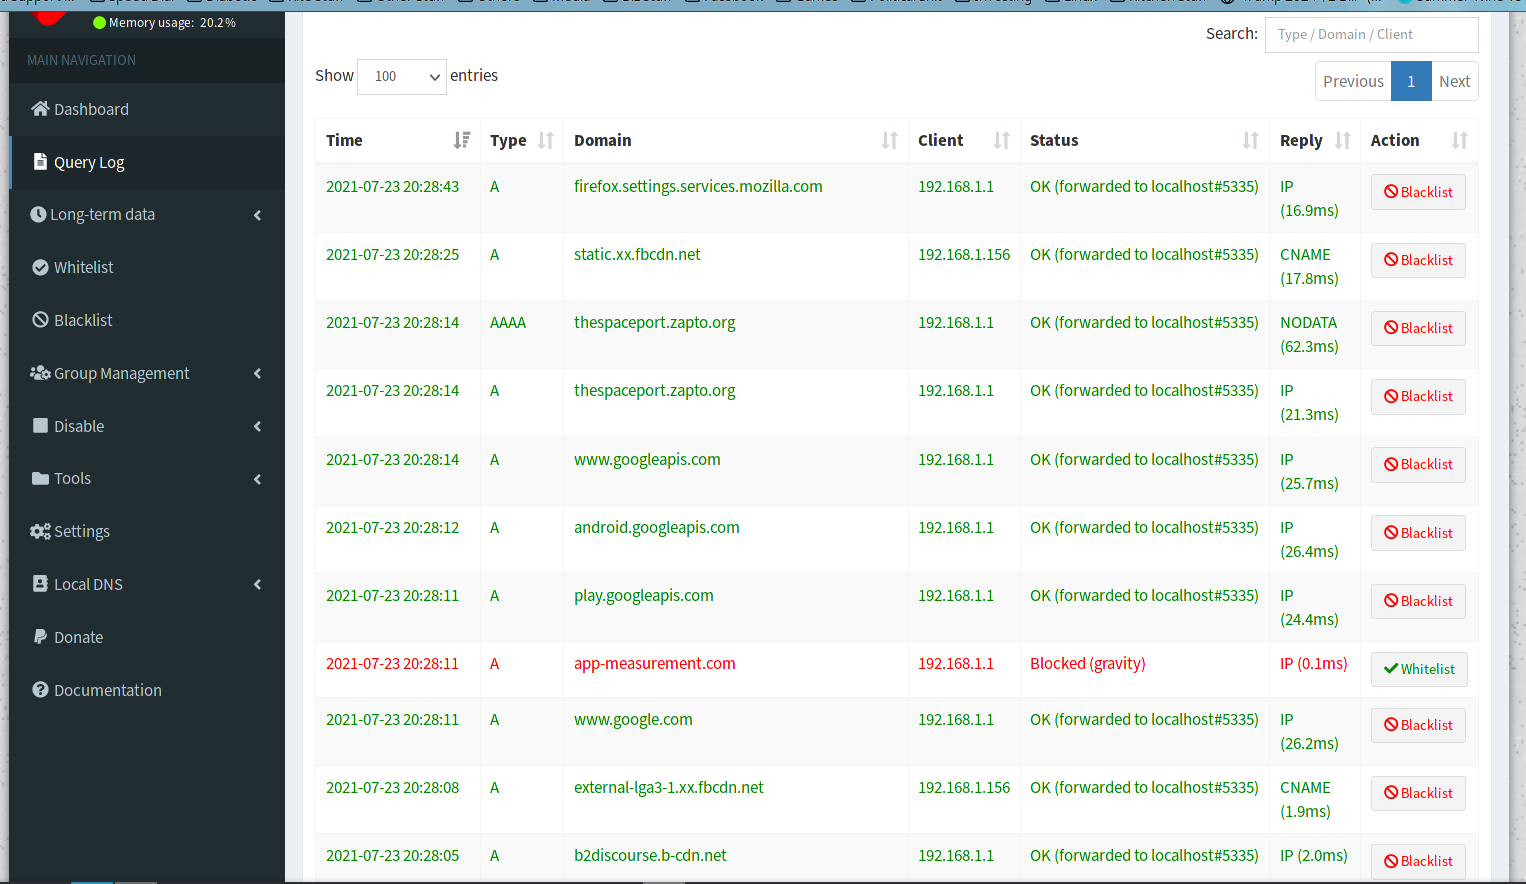
ok, so, after getting my head out of my nethers - I redid the dig command, as you showed (and I somehow managed to ignore)....this was after run number 6

$ dig pi-hole.net @127.0.0.1

; <<>> DiG 9.11.5-P4-5.1+deb10u5-Raspbian <<>> pi-hole.net (at)127.0.0.1
;; global options: +cmd
;; Got answer:
;; ->>HEADER<<- opcode: QUERY, status: NOERROR, id: 27785
;; flags: qr rd ra; QUERY: 1, ANSWER: 1, AUTHORITY: 0, ADDITIONAL: 1

;; OPT PSEUDOSECTION:
; EDNS: version: 0, flags:; udp: 4096
;; QUESTION SECTION:
;pi-hole.net.			IN	A

;; ANSWER SECTION:
pi-hole.net.		840	IN	A	178.128.134.214

;; Query time: 1 msec
;; SERVER: 127.0.0.1#53(127.0.0.1)
;; WHEN: Fri Jul 23 17:54:58 EDT 2021
;; MSG SIZE  rcvd: 56

Okay, that's from cache.

The TTL for the A record for pi-hole.net (per this website, for reference) is 900 seconds (15 minutes). Depending on which upstream DNS server you use, it may be less than that in your reply from the upstream nameserver.

https://dnsviz.net/d/pi-hole.net/dnssec/

If I dig this domain from Cloudflare, I get a TTL of less than 900 seconds. Subsequent digs to Cloudflare show widely different TTLs.

dig pi-hole.net @1.1.1.1

;; ANSWER SECTION:
pi-hole.net. 59 IN A 178.128.134.214
;; Query time: 23 msec
;; SERVER: 1.1.1.1#53(1.1.1.1)

Same dig to Quad 9 gets the full TTL:

dig pi-hole.net @9.9.9.9

; <<>> DiG 9.11.5-P4-5.1+deb10u5-Raspbian <<>> pi-hole.net @9.9.9.9

;; ANSWER SECTION:
pi-hole.net. 900 IN A 178.128.134.214
;; Query time: 69 msec
;; SERVER: 9.9.9.9#53(9.9.9.9)

so, this set of status and replies are normal then?
I could have sworn the previous install showed a LOT more status with 'cached' in it...

In the search box, type "Pi-hole.net" after you do some of the digs showing the 1ms/0ms responses.

1 Like