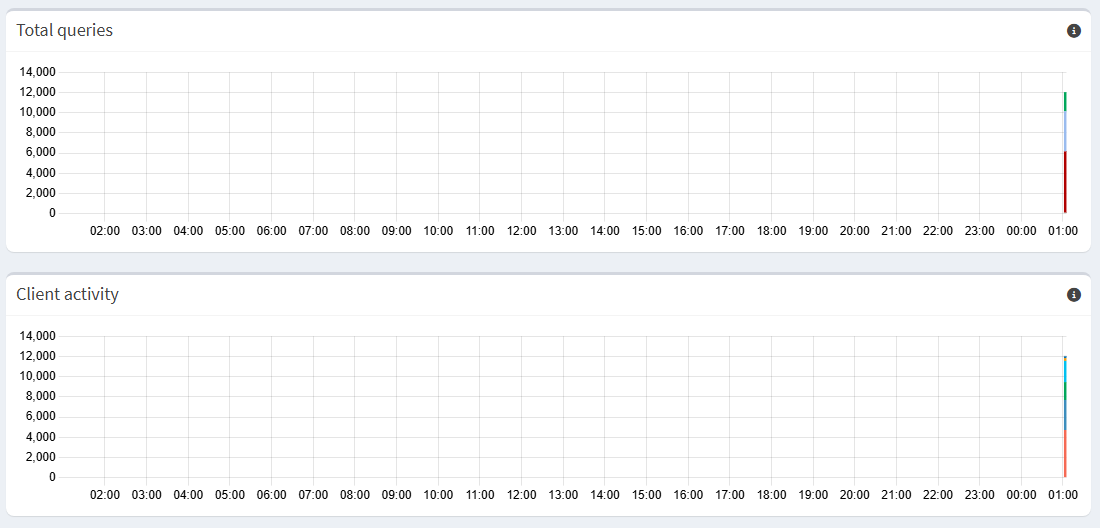
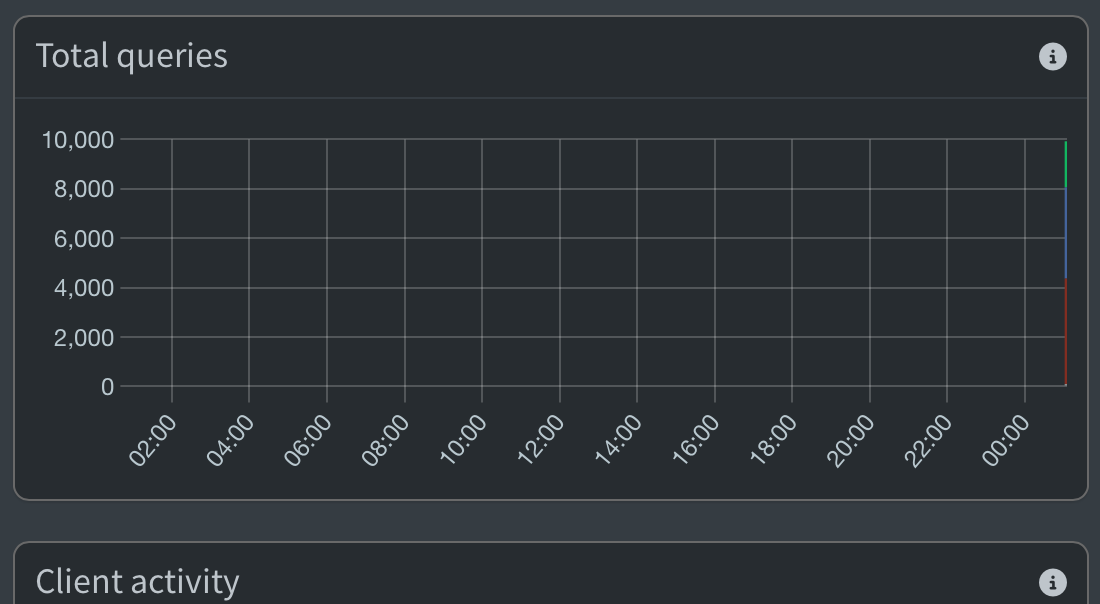
After an upgrade to Core v6.4FTL v6.5Web interface v6.4.1 last week the dashboard for “Total queries” and “Client activity” do no longer update, just vertical bar on the right-hand side of the graph and it stays as it is as time passes.
Have done a reboot the day before. Though symptoms persist.
Thanks. This seems to be a real bug in our FTL component rather then some display issue with the web interface because only the last timestamp from the API contains values
i have exactly the same issue after i updated my raspberry 4b and raspberry 5 - i have the same output history with a lot of zeros and only the last timestamp with informations
The date & time on all my devices are the same. I only know when I restart the device running PiHole it will go out to the Internet (once connection is established) to sync its date & time with a defined NTP server.
We don't know yet what is causing the issue. We suspect this is a FTL bug, but we couldn't replicate the issue and this is currently just a guess.
I don't know.
It is up to you.
Since no one else could reproduce the issue reliably until now, it would be great to have your data to helps us find out what is broken.
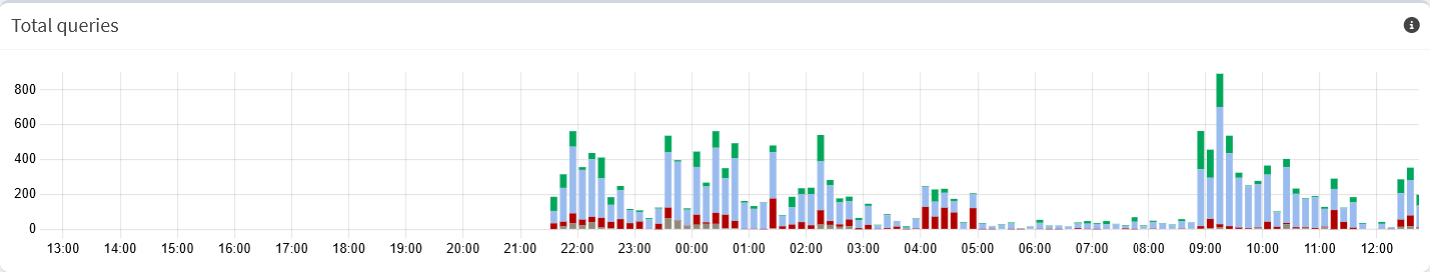
On the other hand, if you want to fix your graphic, there is a good chance that deleting the database will fix it. Go ahead and try it.