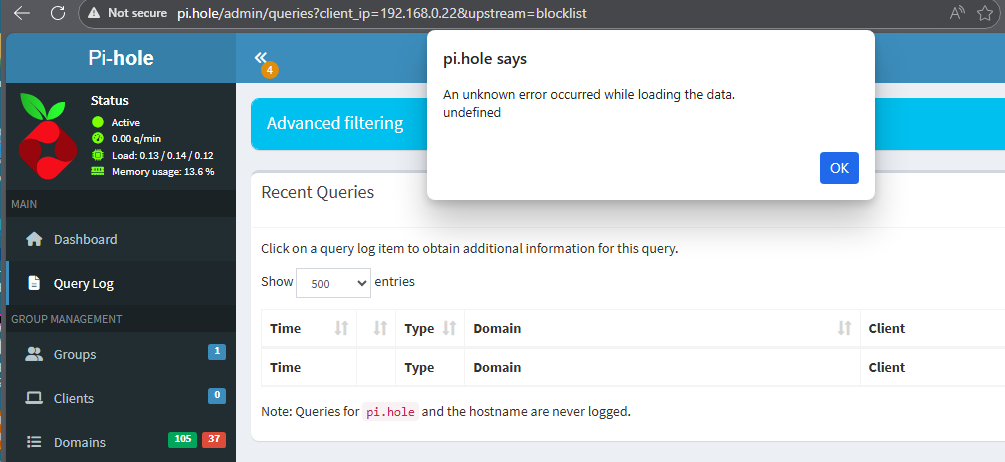
Haven’t you heard ?!
Pi-Hole can travel through time !!! ![]()
![]()
![]()
![]()
![]()
Haven’t you heard ?!
Pi-Hole can travel through time !!! ![]()
![]()
![]()
![]()
![]()
Could you please enable debug.overtime, e.g. via
sudo pihole-FTL --config debug.overtime true
or via the web interface, environment variable?
It should add relevant information into /var/log/pihole/FTL.log. Then, please restart pihole-FTL and upload the log here. You can also use
cat /var/log/pihole/FTL.log | pihole tricorder
to securely upload this to a place where only Pi-hole developers can access it. In this case, you'd need to provide the debug token you'll receive in reply to this command (you may or not need sudo for this, depending on the permissions of your login user)
I have fired the following command on the SSH prompt:
sudo pihole-FTL --config debug.overtime true
and got as output "true".
I then fired the following commands:
sudo systemctl restart pihole-FTL
systemctl status pihole-FTL
and got the following output:
 pihole-FTL.service - Pi-hole FTL
     Loaded: loaded (/etc/systemd/system/pihole-FTL.service; enabled; vendor preset: enabled)
     Active: active (running) since Wed 2026-02-25 23:05:10 CET; 10s ago
    Process: 4799 ExecStartPre=/opt/pihole/pihole-FTL-prestart.sh (code=exited, status=0/SUCCESS)
   Main PID: 4824 (pihole-FTL)
      Tasks: 9 (limit: 990)
        CPU: 8.962s
     CGroup: /system.slice/pihole-FTL.service
             └─4824 /usr/bin/pihole-FTL -f

Feb 25 23:05:11 dnsbox pihole-FTL[4824]: 2026-02-25 23:05:10.765 CET [4824M] DEBUG_OVERTIME: initSlot(131, 1772049300): Zeroing overTime slot at >
Feb 25 23:05:11 dnsbox pihole-FTL[4824]: 2026-02-25 23:05:10.766 CET [4824M] DEBUG_OVERTIME: initSlot(132, 1772049900): Zeroing overTime slot at >
Feb 25 23:05:11 dnsbox pihole-FTL[4824]: 2026-02-25 23:05:10.766 CET [4824M] DEBUG_OVERTIME: initSlot(133, 1772050500): Zeroing overTime slot at >
Feb 25 23:05:11 dnsbox pihole-FTL[4824]: 2026-02-25 23:05:10.766 CET [4824M] DEBUG_OVERTIME: initSlot(134, 1772051100): Zeroing overTime slot at >
Feb 25 23:05:11 dnsbox pihole-FTL[4824]: 2026-02-25 23:05:10.767 CET [4824M] DEBUG_OVERTIME: initSlot(135, 1772051700): Zeroing overTime slot at >
Feb 25 23:05:11 dnsbox pihole-FTL[4824]: 2026-02-25 23:05:10.767 CET [4824M] DEBUG_OVERTIME: initSlot(136, 1772052300): Zeroing overTime slot at >
Feb 25 23:05:11 dnsbox pihole-FTL[4824]: 2026-02-25 23:05:10.767 CET [4824M] DEBUG_OVERTIME: initSlot(137, 1772052900): Zeroing overTime slot at >
Feb 25 23:05:11 dnsbox pihole-FTL[4824]: 2026-02-25 23:05:10.768 CET [4824M] DEBUG_OVERTIME: initSlot(138, 1772053500): Zeroing overTime slot at >
Feb 25 23:05:11 dnsbox pihole-FTL[4824]: 2026-02-25 23:05:10.768 CET [4824M] DEBUG_OVERTIME: initSlot(139, 1772054100): Zeroing overTime slot at >
Feb 25 23:05:13 dnsbox pihole-FTL[4824]: 2026-02-25 23:05:10.770 CET [4824M] DEBUG_OVERTIME:
lines 1-20/20 (END)
I have fired the command:
sudo sh -c 'cat /var/log/pihole/FTL.log | pihole tricorder'
and got the following token confirmed:
https://tricorder.pi-hole.net/S04P098k/
Please let me know if you need anything else.
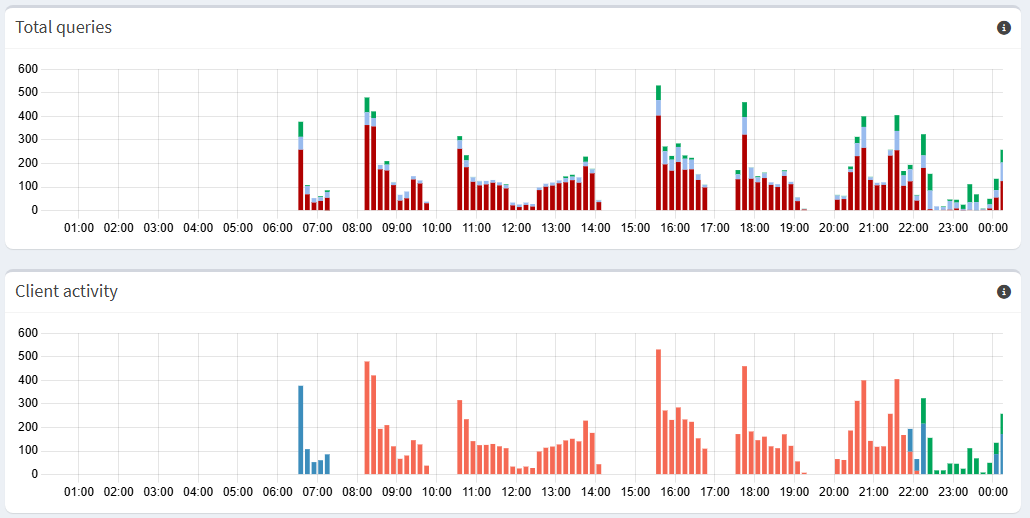
Are you sure the graphic didn't move 1 slot/bar?
Your log shows all data was moved.
All timeslots were shifted (1 - 145 to 0 - 144) causing the first timeslot to be discarded... and the last one (144) was initialized:
2026-02-25 23:09:00.250 CET [4824/T4829] DEBUG_OVERTIME: moveOverTimeMemory(): IS: 1771970700, SHOULD: 1771971300, MOVING: 1
2026-02-25 23:09:00.251 CET [4824/T4829] DEBUG_OVERTIME: moveOverTimeMemory(): Moving overTime 1 - 145 to 0 - 144
2026-02-25 23:09:00.253 CET [4824/T4829] DEBUG_OVERTIME: initSlot(144, 1772057700): Zeroing overTime slot at 2026-02-25 23:15:00
After that, we can see some data was added to the slots 143 and 144:
2026-02-25 23:09:52.028 CET [4824M] DEBUG_OVERTIME: getOverTimeID(1772057100): 143
2026-02-25 23:09:52.030 CET [4824M] DEBUG_OVERTIME: getOverTimeID(1772057100): 143
2026-02-25 23:09:52.031 CET [4824M] DEBUG_OVERTIME: overTime[143].total += 1 = 46
2026-02-25 23:09:52.033 CET [4824M] DEBUG_OVERTIME: getOverTimeID(1772057100): 143
2026-02-25 23:09:52.035 CET [4824M] DEBUG_OVERTIME: overTime[143].cached++ = 25 (new_status = CACHE_STALE), ID = 18
2026-02-25 23:11:01.963 CET [4824M] DEBUG_OVERTIME: getOverTimeID(1772057700): 144
2026-02-25 23:11:01.965 CET [4824M] DEBUG_OVERTIME: getOverTimeID(1772057700): 144
2026-02-25 23:11:01.966 CET [4824M] DEBUG_OVERTIME: overTime[144].total += 1 = 1
2026-02-25 23:11:01.968 CET [4824M] DEBUG_OVERTIME: getOverTimeID(1772057700): 144
2026-02-25 23:11:01.969 CET [4824M] DEBUG_OVERTIME: overTime[144].cached++ = 1 (new_status = CACHE), ID = 19
2026-02-25 23:11:49.600 CET [4824M] DEBUG_OVERTIME: getOverTimeID(1772057700): 144
2026-02-25 23:11:49.602 CET [4824M] DEBUG_OVERTIME: getOverTimeID(1772057700): 144
2026-02-25 23:11:49.603 CET [4824M] DEBUG_OVERTIME: overTime[144].total += 1 = 2
2026-02-25 23:11:49.612 CET [4824M] DEBUG_OVERTIME: getOverTimeID(1772057700): 144
2026-02-25 23:11:49.614 CET [4824M] DEBUG_OVERTIME: overTime[144].forwarded++ = 1 (new_status = FORWARDED), ID = 20
2026-02-25 23:11:49.637 CET [4824M] DEBUG_OVERTIME: getOverTimeID(1772057700): 144
2026-02-25 23:11:49.639 CET [4824M] DEBUG_OVERTIME: getOverTimeID(1772057700): 144
2026-02-25 23:11:49.641 CET [4824M] DEBUG_OVERTIME: overTime[144].total += 1 = 3
2026-02-25 23:11:49.643 CET [4824M] DEBUG_OVERTIME: getOverTimeID(1772057700): 144
2026-02-25 23:11:49.644 CET [4824M] DEBUG_OVERTIME: overTime[144].forwarded++ = 2 (new_status = FORWARDED), ID = 21
...
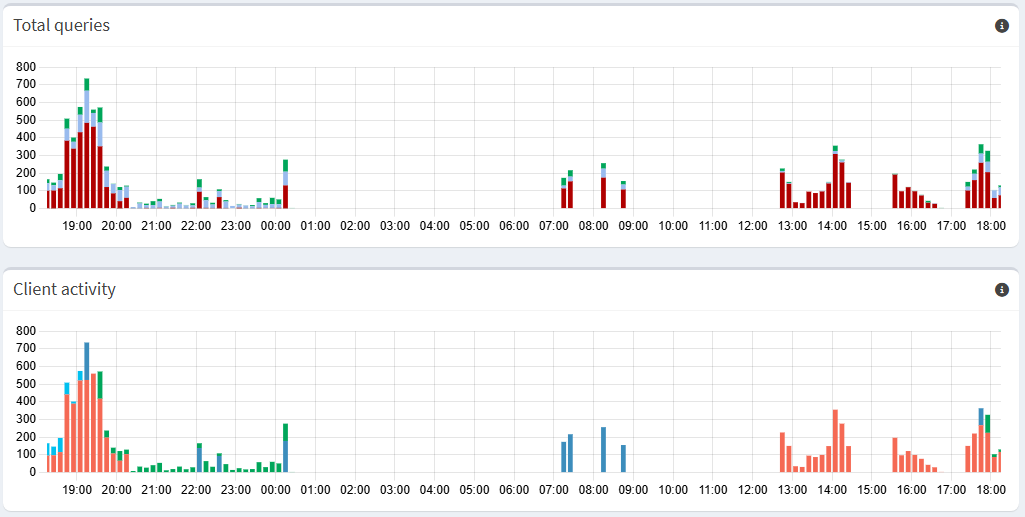
Can you please reload the page and check if there are 2 or more bars at the end of the graphic?
Shall I keep this setting from now on or can I fire the commands
sudo pihole-FTL --config debug.overtime false
sudo systemctl restart pihole-FTL
to revert it back?
If the issue is still happening, please upload FLT.log again (cat /var/log/pihole/FTL.log | pihole tricorder). This way we will have more data, if needed.
After that (or if the issue is gone), you can disable debug.overtime.
Thank you for providing the information.
It looks like Pi-hole is working as expected.
Yes, this is the outcome or the solution in my case. Though, what is the root cause that may have caused this situation?