I'm using the API to get stats into an influx database for grafana. This was working great until I upgraded to V3+. Since then the forwarders part of the API is broken.
When I reboot the pi zero and run the command manually I get a result as expected. If I try and run it a few times it stops working. It just returns a blank result. No errors just blank.
I'm also using the API to get the summary data and this seems to work always.
These are the 2 commands I am using in the bash script but I get the same result if I run the curl manually.
It was giving me [] the other day. Last night it was giving me blank. This morning, after I rebooted it now its working. Crap. Lets see tonight. Every night at midnight FTL craps out and I need to reboot so after that its an anything game what works.
There is no reason. It just says FTL is not running in the web and in the command line if I query it. Here is the log. At 12:04 I restarted it.
[2017-05-19 21:13:09.366] New forward server: 84.200.69.80 resolver1.ihgip.net (6/8)
[2017-05-19 21:13:54.102] New forward server: 84.200.69.80 resolver1.ihgip.net (7/8)
[2017-05-19 21:13:54.103] Notice: Increasing forwarded struct size from 8 to 12 (1.36 MB)
[2017-05-19 21:14:47.250] New forward server: 84.200.69.80 resolver1.ihgip.net (8/12)
[2017-05-19 21:15:13.351] New forward server: 84.200.69.80 resolver1.ihgip.net (9/12)
[2017-05-20 00:00:17.376] NOTICE: pihole.log has been flushed
[2017-05-20 00:00:17.377]   Resetting internal data structure
[2017-05-20 00:00:17.377]   Queries in memory before flushing: 35731
[2017-05-20 00:04:14.839] ########## FTL started! ##########
[2017-05-20 00:04:14.842] FTL branch: (no branch)
[2017-05-20 00:04:14.843] FTL hash: v2.7.3
[2017-05-20 00:04:14.843] FTL date: 2017-05-15 14:20:25 +0200
[2017-05-20 00:04:14.844] FTL user: pihole
[2017-05-20 00:04:14.844] Notice: Found no readable FTL config file
[2017-05-20 00:04:14.844]         Using default settings
[2017-05-20 00:04:14.845] Starting config file parsing
[2017-05-20 00:04:14.845]    SOCKET_LISTENING: only local
[2017-05-20 00:04:14.846]    TIMEFRAME: Rolling 24h
[2017-05-20 00:04:14.846]    QUERY_DISPLAY: Show queries
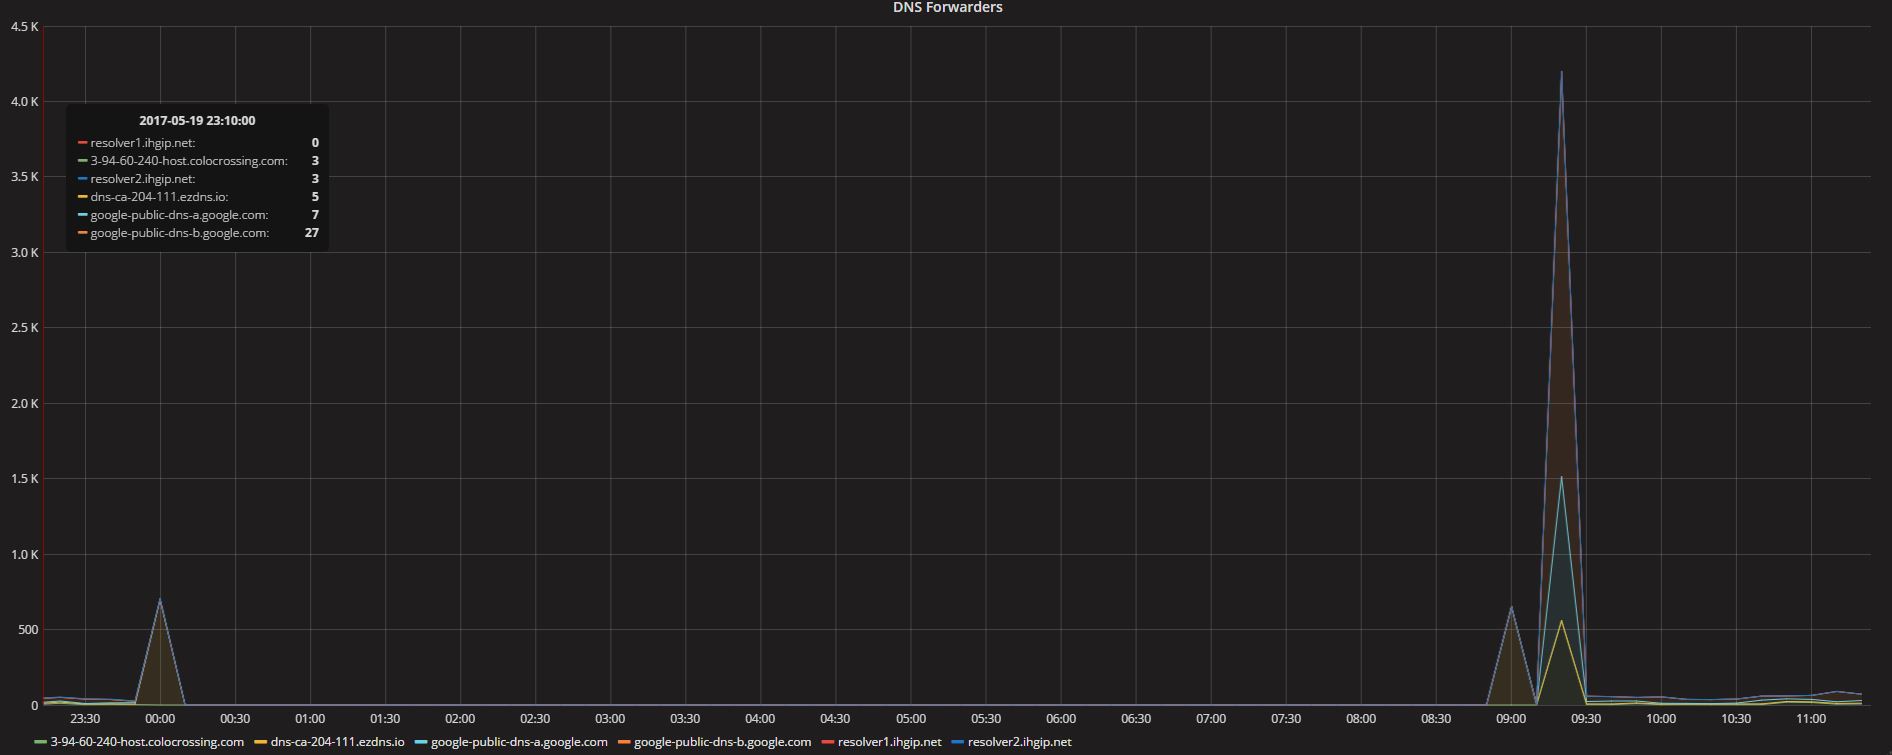
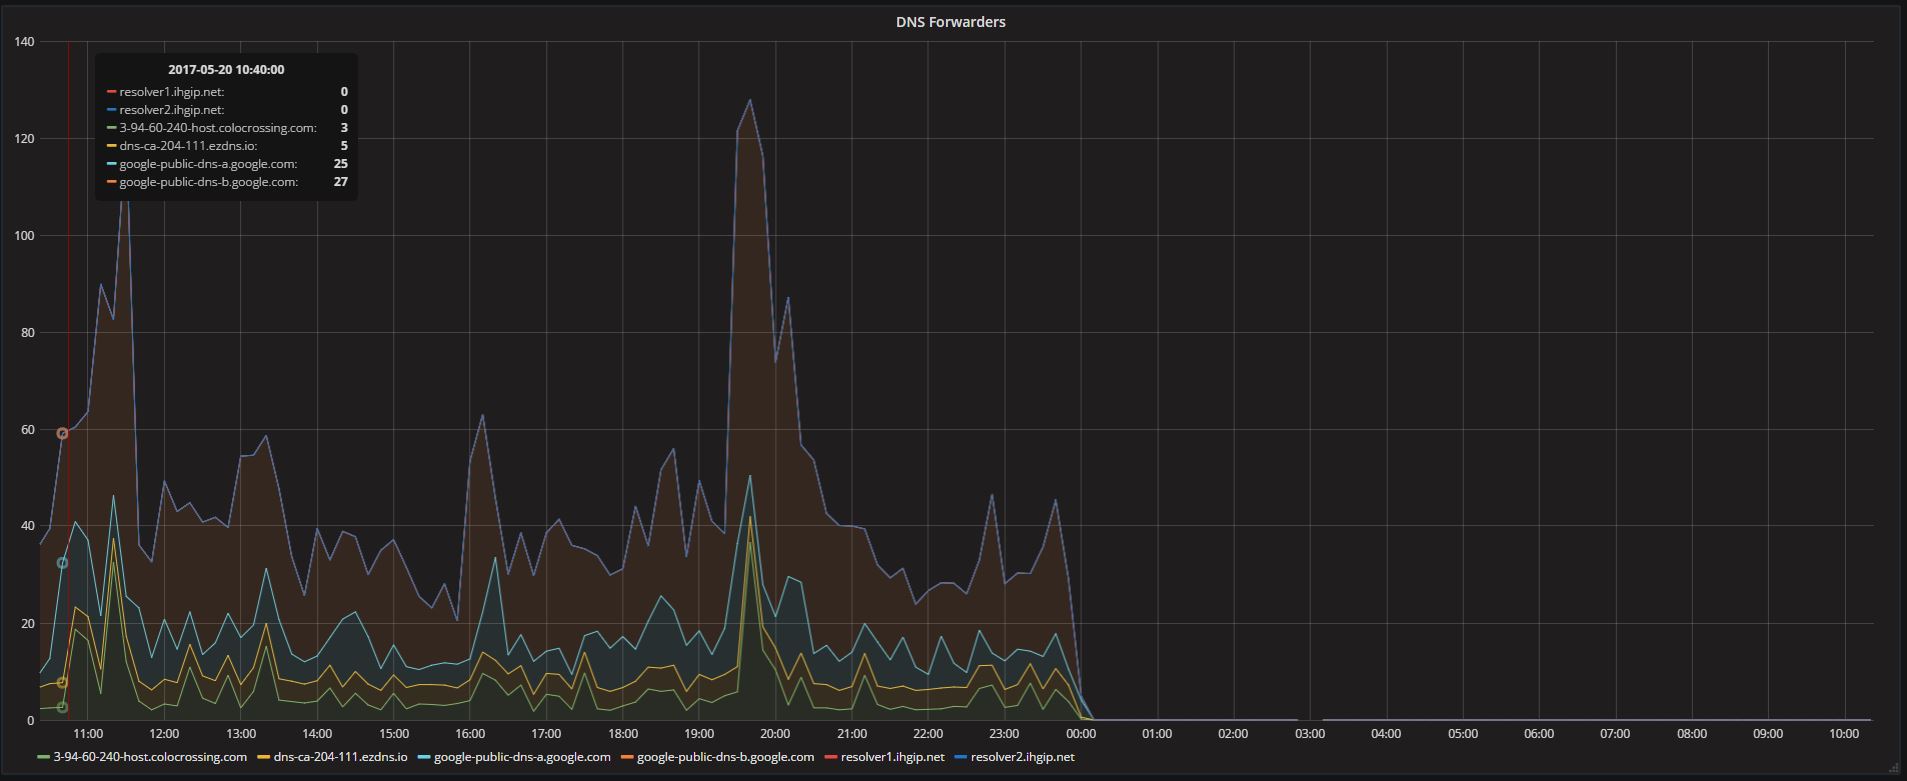
Here is also the graph of the forwarding. At midnight it stopped, I restarted pihole and i get a spike as it counts the difference from the last one, then it didnt work until this morning again a big spike as it caught the difference. Since then its working but at midnight my guess is it will stop again.
That mean that FTL has not crashed but was killed by receiving SIGKILL from someone which is quite an unfriendly action in itself. Do you have any idea what might want to kill FTL ?
This is running a stock raspbian image with only pihole installed. The only thing I am doing is running a bash script to gather Memory, CPU, DNS info from the API. So i have no idea what would cause a sigkill. What can even send this? I'm not that familiar with linux.
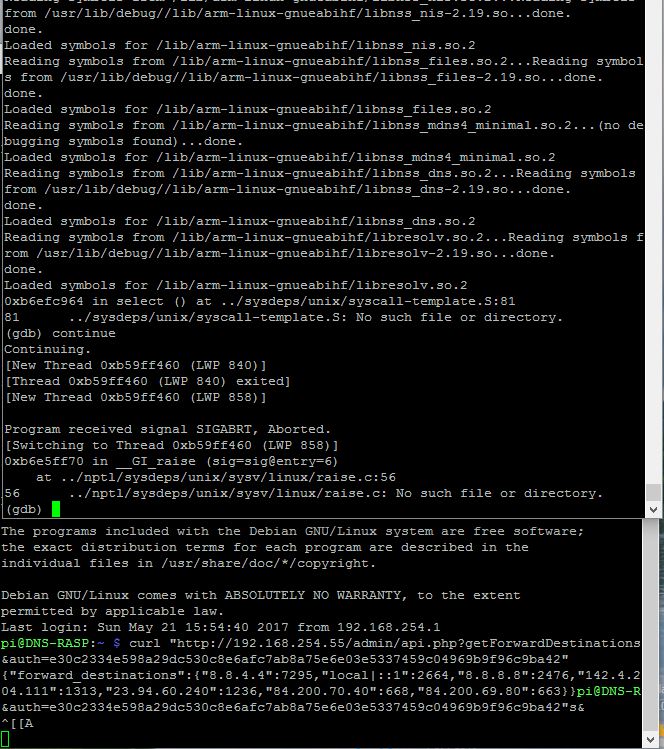
No response on the first one and the second time FTL had stopped again. All within a few mins of the reboot. Something between FTL and the API is also unstable.
The second command didnt finish and FTL is no offline. This is fairly reproducible for me. Fresh reboot. Run this 2x and FTL is offline..
Ran another test:
Reboot, wait a few mins for it to start.
Run the API call once its fine, second time, crash again. I had about 20 seconds between commands. I refreshed the webpage between calls and FTL was running. As soon as I hit the second run of the API I saw the webpage change to FTL offline in the second screen.
Let me know if you need me to run anything else but it looks like an API bug.
Rebooted. Started debugger. In another session I ran the api call twice, got a SIGABRT.
(gdb) continue
Continuing.
[New Thread 0xb59ff460 (LWP 840)]
[Thread 0xb59ff460 (LWP 840) exited]
[New Thread 0xb59ff460 (LWP 858)]

Program received signal SIGABRT, Aborted.
[Switching to Thread 0xb59ff460 (LWP 858)]
0xb6e5ff70 in __GI_raise (sig=sig@entry=6)
at ../nptl/sysdeps/unix/sysv/linux/raise.c:56
56      ../nptl/sysdeps/unix/sysv/linux/raise.c: No such file or directory.
(gdb)
Loaded symbols for /lib/arm-linux-gnueabihf/libnss_files.so.2
Reading symbols from /lib/arm-linux-gnueabihf/libnss_mdns4_minimal.so.2...(no de bugging symbols found)...done.
Loaded symbols for /lib/arm-linux-gnueabihf/libnss_mdns4_minimal.so.2
Reading symbols from /lib/arm-linux-gnueabihf/libnss_dns.so.2...Reading symbols from /usr/lib/debug//lib/arm-linux-gnueabihf/libnss_dns-2.19.so...done.
done.
Loaded symbols for /lib/arm-linux-gnueabihf/libnss_dns.so.2
Reading symbols from /lib/arm-linux-gnueabihf/libresolv.so.2...Reading symbols f rom /usr/lib/debug//lib/arm-linux-gnueabihf/libresolv-2.19.so...done.
done.
Loaded symbols for /lib/arm-linux-gnueabihf/libresolv.so.2
0xb6e7c964 in select () at ../sysdeps/unix/syscall-template.S:81
81 ../sysdeps/unix/syscall-template.S: No such file or directory.
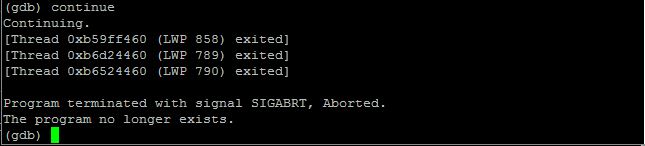
(gdb) continue
Continuing.
[New Thread 0xb58ff460 (LWP 1070)]
[Thread 0xb58ff460 (LWP 1070) exited]
[New Thread 0xb58ff460 (LWP 1074)]
Program received signal SIGABRT, Aborted.
[Switching to Thread 0xb58ff460 (LWP 1074)]
0xb6ddff70 in __GI_raise (sig=sig@entry=6)
at ../nptl/sysdeps/unix/sysv/linux/raise.c:56
56 ../nptl/sysdeps/unix/sysv/linux/raise.c: No such file or directory.
(gdb) bt
#0 0xb6ddff70 in __GI_raise (sig=sig@entry=6)
at ../nptl/sysdeps/unix/sysv/linux/raise.c:56
#1 0xb6de1324 in __GI_abort () at abort.c:89
#2 0xb6e1b954 in __libc_message (do_abort=<optimized out>,
fmt=0xb6ed16e8 "*** Error in `%s': %s: 0x%s ***\n")
at ../sysdeps/posix/libc_fatal.c:175
#3 0xb6e21b80 in malloc_printerr (action=1,
str=0xb6ed1924 "double free or corruption (fasttop)", ptr=<optimized out>)
at malloc.c:4996
#4 0xb6e22b24 in _int_free (av=<optimized out>, p=<optimized out>,
have_lock=-1248861864) at malloc.c:3840
#5 0x7f64c77c in getForwardDestinations (sock=sock@entry=0xb58fea20)
at request.c:502
#6 0x7f64df78 in process_request (
client_message=client_message@entry=0x813eb730 ">forward-dest",
sock=sock@entry=0xb58fea20) at request.c:64
#7 0x7f64b088 in connection_handler_thread (socket_desc=0xb5900468)
at socket.c:213
#8 0xb6ef9e90 in start_thread (arg=0xb58ff460) at pthread_create.c:311
#9 0xb6e83598 in ?? ()
at ../ports/sysdeps/unix/sysv/linux/arm/nptl/../clone.S:92
from /lib/arm-linux-gnueabihf/libc.so.6
Backtrace stopped: previous frame identical to this frame (corrupt stack?)
(gdb)