Not the pretiest or best code but it works for me.
#!/bin/bash
# Traffic logging tool
#
# Cron Jobs:
#
# InfluxDB Stats 1 Minute
# * * * * * influxStats_1m.sh > /dev/null 2>&1
#
# InfluxDB Stats 5 Minute
# 0,10 * * * * influxStats_5m.sh > /dev/null 2>&1
#
# InfluxDB Stats 30 Minute
# 0,30 * * * * influxStats_30m.sh > /dev/null 2>&1

#
# Set Vars
#
DBURL=http://192.168.254.3:8086
DBNAME=statistics
DEVICE="DNS-RASP"
CURDATE=`date +%s`
USER="USERNAME_HERE"
PASSWORD="PASSWORD_HERE"

H=$(date +%-H)
M=$(date +%-M)

#
# CPU
#

# Had to increase to 3 samples because I was getting a spike each time I read it.  This seems to smooth it out more
top -b -n 3 -d.2 | grep "Cpu" |  tail -n 1 | awk '{print $2,$4,$6,$8,$10,$12,$14,$16}' | while read CPUusr CPUsys CPUnic CPUidle CPUio CPUirq CPUsirq CPUst
do
	cat /proc/loadavg | awk '{print $1,$2,$3}'| while read LAVG1 LAVG5 LAVG15
	do
		curl -is -XPOST "$DBURL/write?db=$DBNAME&u=$USER&p=$PASSWORD" --data-binary "cpuStats,Device=${DEVICE} CPUusr=${CPUusr},CPUsys=${CPUsys},CPUnic=${CPUnic},CPUidle=${CPUidle},CPUio=${CPUio},CPUirq=${CPUirq},CPUsirq=${CPUsirq},CPUst=${CPUst},CPULoadAvg1m=${LAVG1},CPULoadAvg5m=${LAVG5},CPULoadAvg15m=${LAVG15} ${CURDATE}000000000" >/dev/null 2>&1
	done
done


#
# CPU Temperature
#

TEMPERATURE=`cat /sys/class/thermal/thermal_zone0/temp | awk '{printf "%0.3f\n",$1/1000}'`

CORE0=0

curl -is -XPOST "$DBURL/write?db=$DBNAME&u=$USER&p=$PASSWORD" --data-binary "CPUtempStats,Device=${DEVICE},Core=${CORE0} Temperature=${TEMPERATURE} ${CURDATE}000000000" >/dev/null 2>&1


#
# GPU Temperature
#
TEMPERATURE=`vcgencmd measure_temp | sed "s/temp=//" | sed "s/'C//"`

curl -is -XPOST "$DBURL/write?db=$DBNAME&u=$USER&p=$PASSWORD" --data-binary "GPUstats,Device=${DEVICE},GPUTemp=${TEMPERATURE} ${CURDATE}000000000" >/dev/null 2>&1


#
# Memory
#
top -bn1 | head -4 | awk '/Mem/ {print $5,$7,$9}' | while read USED FREE CACHE
do
	curl -is -XPOST "$DBURL/write?db=$DBNAME&u=$USER&p=$PASSWORD" --data-binary "memoryStats,Device=${DEVICE} memUsed=${USED},memFree=${FREE},memCache=${CACHE} ${CURDATE}000000000" >/dev/null 2>&1
done


#
# Network
#

if [[ -f byteCount.tmp ]] ; then

	source byteCount.tmp

	currentBytesIn=`cat /proc/net/dev | grep "eth0" | awk '{print $2}'`
	currentBytesOut=`cat /proc/net/dev | grep "eth0" | awk '{print $10}'`
	totalBytesIn=$((currentBytesIn-lastBytesIn))
	totalBytesOut=$((currentBytesOut-lastBytesOut))

	# Prevent negative numbers when the counters reset.  Could miss data but it should be a marginal amount.
	if [ ${totalBytesIn} -le 0 ] ; then
		totalBytesIn=0
	fi
	if [ ${totalBytesOut} -le 0 ] ; then
		totalBytesOut=0
	fi
	echo "Total Bytes In "$totalBytesIn
	echo "Total Bytes Out "$totalBytesOut

	curl -is -XPOST "$DBURL/write?db=$DBNAME&u=$USER&p=$PASSWORD" --data-binary "interfaceStats,Interface=eth0,Device=${DEVICE} bytesIn=${totalBytesIn},bytesOut=${totalBytesOut} ${CURDATE}000000000" >/dev/null 2>&1

	# Write out the current stats to the temp file for the next read

	echo "lastBytesIn="$currentBytesIn > byteCount.tmp
	echo "lastBytesOut="$currentBytesOut >> byteCount.tmp
else
	# Write out blank file

	echo "lastBytesIn=0" > byteCount.tmp
	echo "lastBytesOut=0" >> byteCount.tmp
fi


#
# Disk Stats
#

if [[ -f diskByteCountTest.tmp ]] ; then
	cat /proc/diskstats | grep -E 'mmcblk0p2' | sed 's/md//g' | awk '{print "disk" $3, $6, $10}' | while read DISK currentSectorsRead currentSectorsWrite
	do
		# Check if the disk is in the temp file.
		if grep ${DISK} diskByteCountTest.tmp
		then
			grep ${DISK} diskByteCountTest.tmp | while read lDISK lastSectorsRead lastSectorsWrite
			do
				# Replace current disk stats with new stats for the next read
				sed -i "s/^${DISK}.*/${DISK} ${currentSectorsRead} ${currentSectorsWrite}/" diskByteCountTest.tmp
				# Need to multiply by 512 to convert from sectors to bytes
				(( totalBytesRead = 512 * (${currentSectorsRead} - ${lastSectorsRead}) ))
				(( totalBytesWrite = 512 * (${currentSectorsWrite} - ${lastSectorsWrite}) ))
				(( totalBytes = totalBytesRead + totalBytesWrite))

				curl -is -XPOST "$DBURL/write?db=$DBNAME&u=$USER&p=$PASSWORD" --data-binary "diskStats,Disk=${DISK},Device=${DEVICE} BytesPersec=${totalBytes},ReadBytesPersec=${totalBytesRead},WriteBytesPersec=${totalBytesWrite} ${CURDATE}000000000" >/dev/null 2>&1
			done
		else
			# If the disk wasn't in the temp file then add it to the end
			echo ${DISK} ${currentSectorsRead} ${currentSectorsWrite} >> diskByteCountTest.tmp
		fi
	done
else
	# Write out a new file
	cat /proc/diskstats | grep -E 'mmcblk0p2' | sed 's/md//g' | awk '{print "disk" $3, $6, $10}' | while read DISK currentSectorsRead currentSectorsWrite
	do
		echo ${DISK} ${currentSectorsRead} ${currentSectorsWrite} >> diskByteCountTest.tmp
	done
fi

#
# DNS Stats
#

curl "http://localhost/admin/api.php?summaryRaw" > summaryRaw.tmp

if [ $H -eq 0 -a $M -le 10 ] ; then
	echo "nothing"	#do nothing
else
	curl "http://192.168.254.55/admin/api.php?getForwardDestinations&auth=AUTHKEY" > getForwardDestinations.tmp
fi

currentBlocked=`jq ".ads_blocked_today" summaryRaw.tmp`
currentQueries=`jq ".dns_queries_today" summaryRaw.tmp`
currentDomains_Blocked=`jq ".domains_being_blocked" summaryRaw.tmp`
currentPercent=`jq ".ads_percentage_today" summaryRaw.tmp`

currentDNS1=`jq '.[] | to_entries[] | select(.key | contains("8.8.4.4")) | [.value] | .[]' getForwardDestinations.tmp`
currentDNS2=`jq '.[] | to_entries[] | select(.key | contains("8.8.8.8")) | [.value] | .[]' getForwardDestinations.tmp`
currentDNS3=`jq '.[] | to_entries[] | select(.key | contains("23.94.60.240")) | [.value] | .[]' getForwardDestinations.tmp`
currentDNS4=`jq '.[] | to_entries[] | select(.key | contains("84.200.70.40")) | [.value] | .[]' getForwardDestinations.tmp`
currentDNS5=`jq '.[] | to_entries[] | select(.key | contains("142.4.204.111")) | [.value] | .[]' getForwardDestinations.tmp`
currentDNS6=`jq '.[] | to_entries[] | select(.key | contains("84.200.69.80")) | [.value] | .[]' getForwardDestinations.tmp`

if [[ -f queriesCount.tmp ]] ; then
	lastBlocked=`cat queriesCount.tmp | awk '{print $2}'`
	lastQueries=`cat queriesCount.tmp | awk '{print $3}'`

	lastDNS1=`cat queriesCount.tmp | awk '{print $6}'`
	lastDNS2=`cat queriesCount.tmp | awk '{print $7}'`
	lastDNS3=`cat queriesCount.tmp | awk '{print $8}'`
	lastDNS4=`cat queriesCount.tmp | awk '{print $9}'`
	lastDNS5=`cat queriesCount.tmp | awk '{print $10}'`
	lastDNS6=`cat queriesCount.tmp | awk '{print $11}'`

	diffBlocked=$((currentBlocked-lastBlocked))
	diffQueries=$((currentQueries-lastQueries))
	DNS1=$((currentDNS1-lastDNS1))
	DNS2=$((currentDNS2-lastDNS2))
	DNS3=$((currentDNS3-lastDNS3))
	DNS4=$((currentDNS4-lastDNS4))
	DNS5=$((currentDNS5-lastDNS5))
	DNS6=$((currentDNS6-lastDNS6))


	# Prevent negative numbers when the counters reset.  Could miss data but it should be a marginal amount.
	if [ ${diffBlocked} -le 0 ] ; then
		diffBlocked=0
	fi
	if [ ${diffQueries} -le 0 ] ; then
		diffQueries=0
	fi
	if [ ${DNS1} -le 0 ] || [ ${DNS1} -ge 1000 ] ; then
		DNS1=0
	fi
	if [ ${DNS2} -le 0 ] || [ ${DNS2} -ge 1000 ] ; then
		DNS2=0
	fi
	if [ ${DNS3} -le 0 ] || [ ${DNS3} -ge 1000 ] ; then
		DNS3=0
	fi
	if [ ${DNS4} -le 0 ] || [ ${DNS4} -ge 1000 ] ; then
		DNS4=0
	fi
	if [ ${DNS5} -le 0 ] || [ ${DNS5} -ge 1000 ] ; then
		DNS5=0
	fi
	if [ ${DNS6} -le 0 ] || [ ${DNS6} -ge 1000 ] ; then
		DNS6=0
	fi

	curl -is -XPOST "$DBURL/write?db=$DBNAME&u=$USER&p=$PASSWORD" --data-binary "DNSStats,Device=${DEVICE} Blocked_Queries=${diffBlocked},TotalQueryReceived=${diffQueries},PERCENT_BLOCKED=${currentPercent} ${CURDATE}000000000" >/dev/null 2>&1

	curl -is -XPOST "$DBURL/write?db=$DBNAME&u=$USER&p=$PASSWORD" --data-binary "DNSForwardStats,Device=${DEVICE},Address=google-public-dns-b.google.com Queries=${DNS1} ${CURDATE}000000000"  >/dev/null 2>&1

	curl -is -XPOST "$DBURL/write?db=$DBNAME&u=$USER&p=$PASSWORD" --data-binary "DNSForwardStats,Device=${DEVICE},Address=google-public-dns-a.google.com Queries=${DNS2} ${CURDATE}000000000"  >/dev/null 2>&1

	curl -is -XPOST "$DBURL/write?db=$DBNAME&u=$USER&p=$PASSWORD" --data-binary "DNSForwardStats,Device=${DEVICE},Address=3-94-60-240-host.colocrossing.com Queries=${DNS3} ${CURDATE}000000000"  >/dev/null 2>&1

	curl -is -XPOST "$DBURL/write?db=$DBNAME&u=$USER&p=$PASSWORD" --data-binary "DNSForwardStats,Device=${DEVICE},Address=resolver2.ihgip.net Queries=${DNS4} ${CURDATE}000000000"  >/dev/null 2>&1

	curl -is -XPOST "$DBURL/write?db=$DBNAME&u=$USER&p=$PASSWORD" --data-binary "DNSForwardStats,Device=${DEVICE},Address=dns-ca-204-111.ezdns.io Queries=${DNS5} ${CURDATE}000000000"  >/dev/null 2>&1

	curl -is -XPOST "$DBURL/write?db=$DBNAME&u=$USER&p=$PASSWORD" --data-binary "DNSForwardStats,Device=${DEVICE},Address=resolver1.ihgip.net Queries=${DNS6} ${CURDATE}000000000"  >/dev/null 2>&1

	# Write out the current stats to the temp file for the next read

	echo "data "$currentBlocked $currentQueries $currentPercent $currentDomains_Blocked $currentDNS1 $currentDNS2 $currentDNS3 $currentDNS4 $currentDNS5 $currentDNS6> queriesCount.tmp
else
	# Write out blank file

	echo "data 0 0 0 0 0 0 0 0 0 0" > queriesCount.tmp
fi

rm summaryRaw.tmp
rm getForwardDestinations.tmp
`
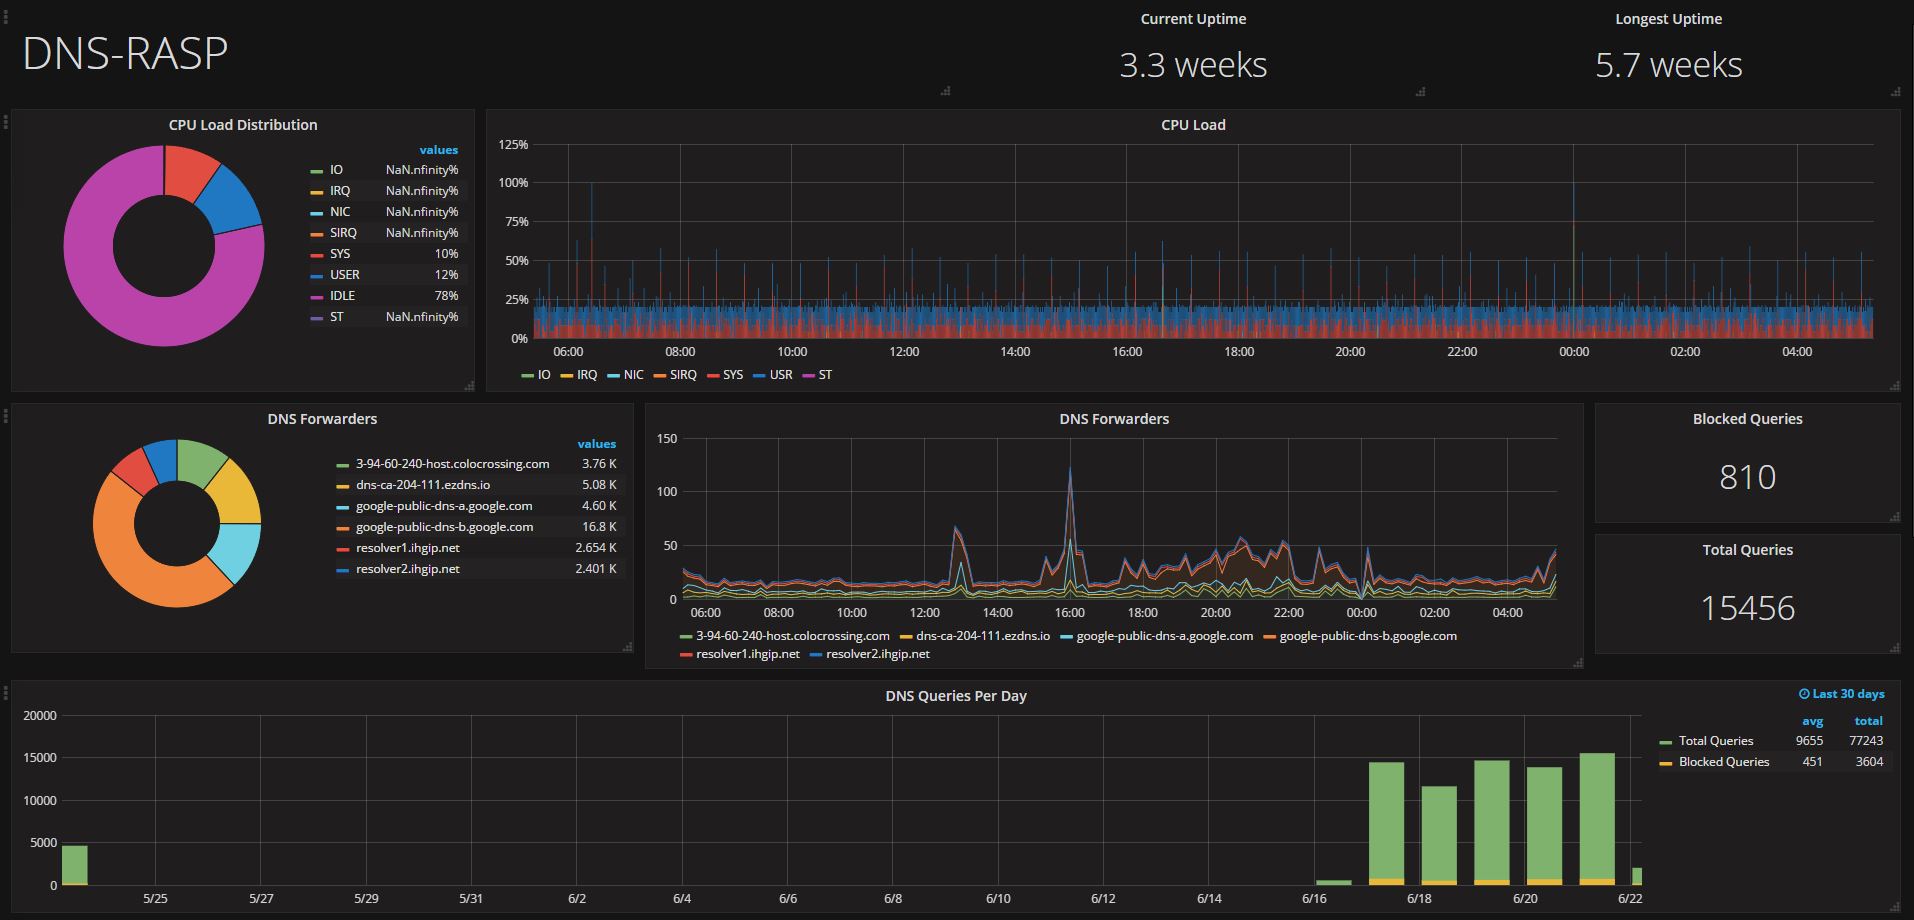
This is the Grafana Json.. Sorry about the length.
{
"__inputs": [
{
"name": "DS_INFLUXDB",
"label": "influxDB",
"description": "",
"type": "datasource",
"pluginId": "influxdb",
"pluginName": "InfluxDB"
}
],
"__requires": [
{
"type": "grafana",
"id": "grafana",
"name": "Grafana",
"version": "4.3.2"
},
{
"type": "panel",
"id": "grafana-piechart-panel",
"name": "Pie Chart",
"version": "1.1.5"
},
{
"type": "panel",
"id": "graph",
"name": "Graph",
"version": ""
},
{
"type": "datasource",
"id": "influxdb",
"name": "InfluxDB",
"version": "1.0.0"
},
{
"type": "panel",
"id": "singlestat",
"name": "Singlestat",
"version": ""
},
{
"type": "panel",
"id": "text",
"name": "Text",
"version": ""
}
],
"annotations": {
"list": []
},
"description": "Raspberry Pi DNS Stats",
"editable": true,
"gnetId": null,
"graphTooltip": 0,
"hideControls": false,
"id": null,
"links": [],
"refresh": "1m",
"rows": [
{
"collapse": false,
"height": "25px",
"panels": [
{
"content": "<style>\n.title {\n height: 50px;\n line-height: 50px;\n white-space: nowrap;\n text-align: left;\n font-weight: 300;\n font-size: 45px;\n font-family: \"Open Sans\";\n}\n\n.singlestat-panel-value, .singlestat-panel-postfix {\n font-weight: 300;\n font-size: 90%;\n font-family: \"Open Sans\";\n}\n</style>\n<span class=\"title\">DNS-RASP</span>\n",
"editable": true,
"error": false,
"height": "79",
"id": 5,
"links": [],
"mode": "html",
"span": 6,
"title": "",
"transparent": true,
"type": "text"
},
{
"cacheTimeout": null,
"colorBackground": false,
"colorValue": false,
"colors": [
"rgba(245, 54, 54, 0.9)",
"rgba(237, 129, 40, 0.89)",
"rgba(50, 172, 45, 0.97)"
],
"datasource": "${DS_INFLUXDB}",
"decimals": 1,
"editable": true,
"error": false,
"format": "s",
"gauge": {
"maxValue": 100,
"minValue": 0,
"show": false,
"thresholdLabels": false,
"thresholdMarkers": true
},
"height": "0px",
"hideTimeOverride": false,
"id": 6,
"interval": "",
"links": [],
"mappingType": 1,
"mappingTypes": [
{
"name": "value to text",
"value": 1
},
{
"name": "range to text",
"value": 2
}
],
"maxDataPoints": 100,
"nullPointMode": "connected",
"nullText": null,
"postfix": "s",
"postfixFontSize": "80%",
"prefix": "",
"prefixFontSize": "30%",
"rangeMaps": [
{
"from": "null",
"text": "N/A",
"to": "null"
}
],
"span": 3,
"sparkline": {
"fillColor": "rgba(31, 118, 189, 0.18)",
"full": false,
"lineColor": "rgb(31, 120, 193)",
"show": false
},
"tableColumn": "",
"targets": [
{
"dsType": "influxdb",
"groupBy": [],
"measurement": "uptime",
"policy": "default",
"query": "SELECT last(\"Uptime\") FROM \"uptime\" WHERE \"Device\" = 'AD-RASP'",
"rawQuery": false,
"refId": "A",
"resultFormat": "time_series",
"select": [
[
{
"params": [
"Uptime"
],
"type": "field"
},
{
"params": [],
"type": "last"
}
]
],
"tags": [
{
"key": "Device",
"operator": "=",
"value": "DNS-RASP"
}
]
}
],
"thresholds": "",
"title": "Current Uptime",
"transparent": true,
"type": "singlestat",
"valueFontSize": "80%",
"valueMaps": [
{
"op": "=",
"text": "N/A",
"value": "null"
}
],
"valueName": "avg"
},
{
"cacheTimeout": null,
"colorBackground": false,
"colorValue": false,
"colors": [
"rgba(245, 54, 54, 0.9)",
"rgba(237, 129, 40, 0.89)",
"rgba(50, 172, 45, 0.97)"
],
"datasource": "${DS_INFLUXDB}",
"decimals": 1,
"editable": true,
"error": false,
"format": "s",
"gauge": {
"maxValue": 100,
"minValue": 0,
"show": false,
"thresholdLabels": false,
"thresholdMarkers": true
},
"height": "0",
"hideTimeOverride": true,
"id": 7,
"interval": "",
"links": [],
"mappingType": 1,
"mappingTypes": [
{
"name": "value to text",
"value": 1
},
{
"name": "range to text",
"value": 2
}
],
"maxDataPoints": 100,
"nullPointMode": "connected",
"nullText": null,
"postfix": "s",
"postfixFontSize": "80%",
"prefix": "",
"prefixFontSize": "30%",
"rangeMaps": [
{
"from": "null",
"text": "N/A",
"to": "null"
}
],
"span": 3,
"sparkline": {
"fillColor": "rgba(31, 118, 189, 0.18)",
"full": false,
"lineColor": "rgb(31, 120, 193)",
"show": false
},
"tableColumn": "",
"targets": [
{
"dsType": "influxdb",
"groupBy": [],
"measurement": "uptime",
"policy": "default",
"query": "SELECT max(\"Uptime\") FROM \"uptime\" WHERE \"Device\" = 'DNS-RASP'",
"rawQuery": true,
"refId": "A",
"resultFormat": "time_series",
"select": [
[
{
"params": [
"Uptime"
],
"type": "field"
},
{
"params": [],
"type": "max"
}
]
],
"tags": [
{
"key": "Device",
"operator": "=",
"value": "AD-VM"
}
]
}
],
"thresholds": "",
"timeFrom": "365d",
"title": "Longest Uptime",
"transparent": true,
"type": "singlestat",
"valueFontSize": "80%",
"valueMaps": [
{
"op": "=",
"text": "N/A",
"value": "null"
}
],
"valueName": "avg"
}
],
"repeat": null,
"repeatIteration": null,
"repeatRowId": null,
"showTitle": false,
"title": "Uptime",
"titleSize": "h6"
},
{
"collapse": false,
"height": 283,
"panels": [
{
"aliasColors": {},
"cacheTimeout": null,
"combine": {
"label": "Others",
"threshold": 0
},
"datasource": "${DS_INFLUXDB}",
"editable": true,
"error": false,
"fontSize": "80%",
"format": "percent",
"id": 12,
"interval": null,
"legend": {
"show": true,
"values": true
},
"legendType": "Right side",
"links": [],
"maxDataPoints": 3,
"nullPointMode": "connected",
"pieType": "donut",
"span": 3,
"strokeWidth": 1,
"targets": [
{
"alias": "IO",
"dsType": "influxdb",
"groupBy": [
{
"params": [
"auto"
],
"type": "time"
},
{
"params": [
"null"
],
"type": "fill"
}
],
"measurement": "cpuStats",
"policy": "default",
"refId": "A",
"resultFormat": "time_series",
"select": [
[
{
"params": [
"CPUio"
],
"type": "field"
},
{
"params": [],
"type": "mean"
}
]
],
"tags": [
{
"key": "Device",
"operator": "=",
"value": "DNS-RASP"
}
]
},
{
"alias": "IRQ",
"dsType": "influxdb",
"groupBy": [
{
"params": [
"auto"
],
"type": "time"
},
{
"params": [
"null"
],
"type": "fill"
}
],
"measurement": "cpuStats",
"policy": "default",
"refId": "B",
"resultFormat": "time_series",
"select": [
[
{
"params": [
"CPUirq"
],
"type": "field"
},
{
"params": [],
"type": "mean"
}
]
],
"tags": [
{
"key": "Device",
"operator": "=",
"value": "DNS-RASP"
}
]
},
{
"alias": "NIC",
"dsType": "influxdb",
"groupBy": [
{
"params": [
"auto"
],
"type": "time"
},
{
"params": [
"null"
],
"type": "fill"
}
],
"measurement": "cpuStats",
"policy": "default",
"refId": "C",
"resultFormat": "time_series",
"select": [
[
{
"params": [
"CPUnic"
],
"type": "field"
},
{
"params": [],
"type": "mean"
}
]
],
"tags": [
{
"key": "Device",
"operator": "=",
"value": "DNS-RASP"
}
]
},
{
"alias": "SIRQ",
"dsType": "influxdb",
"groupBy": [
{
"params": [
"auto"
],
"type": "time"
},
{
"params": [
"null"
],
"type": "fill"
}
],
"measurement": "cpuStats",
"policy": "default",
"refId": "D",
"resultFormat": "time_series",
"select": [
[
{
"params": [
"CPUsirq"
],
"type": "field"
},
{
"params": [],
"type": "mean"
}
]
],
"tags": [
{
"key": "Device",
"operator": "=",
"value": "DNS-RASP"
}
]
},
{
"alias": "SYS",
"dsType": "influxdb",
"groupBy": [
{
"params": [
"auto"
],
"type": "time"
},
{
"params": [
"null"
],
"type": "fill"
}
],
"measurement": "cpuStats",
"policy": "default",
"refId": "E",
"resultFormat": "time_series",
"select": [
[
{
"params": [
"CPUsys"
],
"type": "field"
},
{
"params": [],
"type": "mean"
}
]
],
"tags": [
{
"key": "Device",
"operator": "=",
"value": "DNS-RASP"
}
]
},
{
"alias": "USER",
"dsType": "influxdb",
"groupBy": [
{
"params": [
"auto"
],
"type": "time"
},
{
"params": [
"null"
],
"type": "fill"
}
],
"measurement": "cpuStats",
"policy": "default",
"refId": "F",
"resultFormat": "time_series",
"select": [
[
{
"params": [
"CPUusr"
],
"type": "field"
},
{
"params": [],
"type": "mean"
}
]
],
"tags": [
{
"key": "Device",
"operator": "=",
"value": "DNS-RASP"
}
]
},
{
"alias": "IDLE",
"dsType": "influxdb",
"groupBy": [
{
"params": [
"auto"
],
"type": "time"
},
{
"params": [
"null"
],
"type": "fill"
}
],
"measurement": "cpuStats",
"policy": "default",
"refId": "G",
"resultFormat": "time_series",
"select": [
[
{
"params": [
"CPUidle"
],
"type": "field"
},
{
"params": [],
"type": "mean"
}
]
],
"tags": [
{
"key": "Device",
"operator": "=",
"value": "DNS-RASP"
}
]
},
{
"alias": "ST",
"dsType": "influxdb",
"groupBy": [
{
"params": [
"auto"
],
"type": "time"
},
{
"params": [
"null"
],
"type": "fill"
}
],
"measurement": "cpuStats",
"policy": "default",
"refId": "H",
"resultFormat": "time_series",
"select": [
[
{
"params": [
"CPUst"
],
"type": "field"
},
{
"params": [],
"type": "mean"
}
]
],
"tags": [
{
"key": "Device",
"operator": "=",
"value": "DNS-RASP"
}
]
}
],
"title": "CPU Load Distribution",
"type": "grafana-piechart-panel",
"valueName": "avg"
},
{
"aliasColors": {},
"bars": true,
"dashLength": 10,
"dashes": false,
"datasource": "${DS_INFLUXDB}",
"editable": true,
"error": false,
"fill": 1,
"grid": {},
"id": 13,
"interval": ">60s",
"legend": {
"avg": false,
"current": false,
"max": false,
"min": false,
"show": true,
"total": false,
"values": false
},
"lines": false,
"linewidth": 1,
"links": [],
"nullPointMode": "null",
"percentage": false,
"pointradius": 5,
"points": false,
"renderer": "flot",
"seriesOverrides": [],
"spaceLength": 10,
"span": 9,
"stack": true,
"steppedLine": false,
"targets": [
{
"alias": "IO",
"dsType": "influxdb",
"groupBy": [
{
"params": [
"$interval"
],
"type": "time"
}
],
"measurement": "cpuStats",
"policy": "default",
"refId": "A",
"resultFormat": "time_series",
"select": [
[
{
"params": [
"CPUio"
],
"type": "field"
},
{
"params": [],
"type": "mean"
}
]
],
"tags": [
{
"key": "Device",
"operator": "=",
"value": "DNS-RASP"
}
]
},
{
"alias": "IRQ",
"dsType": "influxdb",
"groupBy": [
{
"params": [
"$interval"
],
"type": "time"
},
{
"params": [
"null"
],
"type": "fill"
}
],
"measurement": "cpuStats",
"policy": "default",
"refId": "B",
"resultFormat": "time_series",
"select": [
[
{
"params": [
"CPUirq"
],
"type": "field"
},
{
"params": [],
"type": "mean"
}
]
],
"tags": [
{
"key": "Device",
"operator": "=",
"value": "DNS-RASP"
}
]
},
{
"alias": "NIC",
"dsType": "influxdb",
"groupBy": [
{
"params": [
"$interval"
],
"type": "time"
},
{
"params": [
"null"
],
"type": "fill"
}
],
"measurement": "cpuStats",
"policy": "default",
"refId": "C",
"resultFormat": "time_series",
"select": [
[
{
"params": [
"CPUnic"
],
"type": "field"
},
{
"params": [],
"type": "mean"
}
]
],
"tags": [
{
"key": "Device",
"operator": "=",
"value": "DNS-RASP"
}
]
},
{
"alias": "SIRQ",
"dsType": "influxdb",
"groupBy": [
{
"params": [
"$interval"
],
"type": "time"
},
{
"params": [
"null"
],
"type": "fill"
}
],
"measurement": "cpuStats",
"policy": "default",
"refId": "D",
"resultFormat": "time_series",
"select": [
[
{
"params": [
"CPUsirq"
],
"type": "field"
},
{
"params": [],
"type": "mean"
}
]
],
"tags": [
{
"key": "Device",
"operator": "=",
"value": "DNS-RASP"
}
]
},
{
"alias": "SYS",
"dsType": "influxdb",
"groupBy": [
{
"params": [
"$interval"
],
"type": "time"
},
{
"params": [
"null"
],
"type": "fill"
}
],
"measurement": "cpuStats",
"policy": "default",
"refId": "E",
"resultFormat": "time_series",
"select": [
[
{
"params": [
"CPUsys"
],
"type": "field"
},
{
"params": [],
"type": "mean"
}
]
],
"tags": [
{
"key": "Device",
"operator": "=",
"value": "DNS-RASP"
}
]
},
{
"alias": "USR",
"dsType": "influxdb",
"groupBy": [
{
"params": [
"$interval"
],
"type": "time"
}
],
"measurement": "cpuStats",
"policy": "default",
"refId": "F",
"resultFormat": "time_series",
"select": [
[
{
"params": [
"CPUusr"
],
"type": "field"
},
{
"params": [],
"type": "mean"
}
]
],
"tags": [
{
"key": "Device",
"operator": "=",
"value": "DNS-RASP"
}
]
},
{
"alias": "ST",
"dsType": "influxdb",
"groupBy": [
{
"params": [
"$interval"
],
"type": "time"
},
{
"params": [
"null"
],
"type": "fill"
}
],
"measurement": "cpuStats",
"policy": "default",
"refId": "G",
"resultFormat": "time_series",
"select": [
[
{
"params": [
"CPUst"
],
"type": "field"
},
{
"params": [],
"type": "mean"
}
]
],
"tags": [
{
"key": "Device",
"operator": "=",
"value": "DNS-RASP"
}
]
},
{
"alias": "ST",
"dsType": "influxdb",
"groupBy": [
{
"params": [
"$interval"
],
"type": "time"
},
{
"params": [
"null"
],
"type": "fill"
}
],
"hide": true,
"measurement": "cpuStats",
"policy": "default",
"refId": "H",
"resultFormat": "time_series",
"select": [
[
{
"params": [
"CPUidle"
],
"type": "field"
},
{
"params": [],
"type": "mean"
}
]
],
"tags": [
{
"key": "Device",
"operator": "=",
"value": "DNS-RASP"
}
]
}
],
"thresholds": [],
"timeFrom": null,
"timeShift": null,
"title": "CPU Load",
"tooltip": {
"msResolution": true,
"shared": true,
"sort": 0,
"value_type": "individual"
},
"type": "graph",
"xaxis": {
"buckets": null,
"mode": "time",
"name": null,
"show": true,
"values": []
},
"yaxes": [
{
"format": "percent",
"label": null,
"logBase": 1,
"max": null,
"min": null,
"show": true
},
{
"format": "percent",
"label": null,
"logBase": 1,
"max": null,
"min": null,
"show": false
}
]
}
],
"repeat": null,
"repeatIteration": null,
"repeatRowId": null,
"showTitle": false,
"title": "CPU",
"titleSize": "h6"
},
{
"collapse": false,
"height": 229,
"panels": [
{
"aliasColors": {},
"cacheTimeout": null,
"combine": {
"label": "Others",
"threshold": 0
},
"datasource": "${DS_INFLUXDB}",
"fontSize": "80%",
"format": "short",
"height": "250px",
"id": 18,
"interval": ">60s",
"legend": {
"percentage": false,
"show": true,
"values": true
},
"legendType": "Right side",
"links": [],
"maxDataPoints": 3,
"minSpan": 2,
"nullPointMode": "connected",
"pieType": "donut",
"span": 4,
"strokeWidth": "1",
"targets": [
{
"alias": "$tag_Address",
"dsType": "influxdb",
"groupBy": [
{
"params": [
"$interval"
],
"type": "time"
},
{
"params": [
"Address"
],
"type": "tag"
}
],
"measurement": "DNSForwardStats",
"policy": "default",
"refId": "A",
"resultFormat": "time_series",
"select": [
[
{
"params": [
"Queries"
],
"type": "field"
},
{
"params": [],
"type": "sum"
}
]
],
"tags": [
{
"key": "Device",
"operator": "=",
"value": "DNS-RASP"
}
]
}
],
"title": "DNS Forwarders",
"transparent": false,
"type": "grafana-piechart-panel",
"valueName": "total"
},
{
"aliasColors": {},
"bars": false,
"dashLength": 10,
"dashes": false,
"datasource": "${DS_INFLUXDB}",
"fill": 1,
"height": "250px",
"id": 19,
"interval": ">600s",
"legend": {
"avg": false,
"current": false,
"max": false,
"min": false,
"show": true,
"total": false,
"values": false
},
"lines": true,
"linewidth": 1,
"links": [],
"nullPointMode": "null",
"percentage": false,
"pointradius": 5,
"points": false,
"renderer": "flot",
"seriesOverrides": [
{
"alias": "Total"
}
],
"spaceLength": 10,
"span": 6,
"stack": true,
"steppedLine": false,
"targets": [
{
"alias": "$tag_Address",
"dsType": "influxdb",
"groupBy": [
{
"params": [
"$interval"
],
"type": "time"
},
{
"params": [
"Address"
],
"type": "tag"
},
{
"params": [
"null"
],
"type": "fill"
}
],
"measurement": "DNSForwardStats",
"policy": "default",
"refId": "A",
"resultFormat": "time_series",
"select": [
[
{
"params": [
"Queries"
],
"type": "field"
},
{
"params": [],
"type": "mean"
}
]
],
"tags": [
{
"key": "Device",
"operator": "=",
"value": "DNS-RASP"
}
]
},
{
"alias": "Total",
"dsType": "influxdb",
"groupBy": [
{
"params": [
"$interval"
],
"type": "time"
},
{
"params": [
"null"
],
"type": "fill"
}
],
"hide": true,
"measurement": "DNSStats",
"policy": "default",
"refId": "B",
"resultFormat": "time_series",
"select": [
[
{
"params": [
"TotalQueryReceived"
],
"type": "field"
},
{
"params": [],
"type": "mean"
}
]
],
"tags": [
{
"key": "Device",
"operator": "=",
"value": "DNS-RASP"
}
]
}
],
"thresholds": [],
"timeFrom": null,
"timeShift": null,
"title": "DNS Forwarders",
"tooltip": {
"shared": true,
"sort": 1,
"value_type": "individual"
},
"type": "graph",
"xaxis": {
"buckets": null,
"mode": "time",
"name": null,
"show": true,
"values": []
},
"yaxes": [
{
"format": "short",
"label": null,
"logBase": 1,
"max": null,
"min": null,
"show": true
},
{
"format": "short",
"label": null,
"logBase": 1,
"max": null,
"min": null,
"show": true
}
]
},
{
"cacheTimeout": null,
"colorBackground": false,
"colorValue": false,
"colors": [
"rgba(245, 54, 54, 0.9)",
"rgba(237, 129, 40, 0.89)",
"rgba(50, 172, 45, 0.97)"
],
"datasource": "${DS_INFLUXDB}",
"format": "none",
"gauge": {
"maxValue": 100,
"minValue": 0,
"show": false,
"thresholdLabels": false,
"thresholdMarkers": true
},
"height": "120",
"id": 15,
"interval": null,
"links": [],
"mappingType": 1,
"mappingTypes": [
{
"name": "value to text",
"value": 1
},
{
"name": "range to text",
"value": 2
}
],
"maxDataPoints": 100,
"minSpan": null,
"nullPointMode": "connected",
"nullText": null,
"postfix": "",
"postfixFontSize": "50%",
"prefix": "",
"prefixFontSize": "50%",
"rangeMaps": [
{
"from": "null",
"text": "N/A",
"to": "null"
}
],
"span": 2,
"sparkline": {
"fillColor": "rgba(31, 118, 189, 0.18)",
"full": false,
"lineColor": "rgb(31, 120, 193)",
"show": false
},
"tableColumn": "",
"targets": [
{
"alias": "Blocked Queries",
"dsType": "influxdb",
"groupBy": [],
"measurement": "DNSStats",
"policy": "default",
"refId": "A",
"resultFormat": "time_series",
"select": [
[
{
"params": [
"Blocked_Queries"
],
"type": "field"
},
{
"params": [],
"type": "sum"
}
]
],
"tags": [
{
"key": "Device",
"operator": "=",
"value": "DNS-RASP"
}
]
}
],
"thresholds": "",
"title": "Blocked Queries",
"type": "singlestat",
"valueFontSize": "80%",
"valueMaps": [
{
"op": "=",
"text": "N/A",
"value": "null"
}
],
"valueName": "avg"
},
{
"cacheTimeout": null,
"colorBackground": false,
"colorValue": false,
"colors": [
"rgba(245, 54, 54, 0.9)",
"rgba(237, 129, 40, 0.89)",
"rgba(50, 172, 45, 0.97)"
],
"datasource": "${DS_INFLUXDB}",
"format": "none",
"gauge": {
"maxValue": 100,
"minValue": 0,
"show": false,
"thresholdLabels": false,
"thresholdMarkers": true
},
"height": "120",
"id": 16,
"interval": null,
"links": [],
"mappingType": 1,
"mappingTypes": [
{
"name": "value to text",
"value": 1
},
{
"name": "range to text",
"value": 2
}
],
"maxDataPoints": 100,
"minSpan": null,
"nullPointMode": "connected",
"nullText": null,
"postfix": "",
"postfixFontSize": "50%",
"prefix": "",
"prefixFontSize": "50%",
"rangeMaps": [
{
"from": "null",
"text": "N/A",
"to": "null"
}
],
"span": 2,
"sparkline": {
"fillColor": "rgba(31, 118, 189, 0.18)",
"full": false,
"lineColor": "rgb(31, 120, 193)",
"show": false
},
"tableColumn": "",
"targets": [
{
"alias": "Total Queries",
"dsType": "influxdb",
"groupBy": [],
"measurement": "DNSStats",
"policy": "default",
"refId": "A",
"resultFormat": "time_series",
"select": [
[
{
"params": [
"TotalQueryReceived"
],
"type": "field"
},
{
"params": [],
"type": "sum"
}
]
],
"tags": [
{
"key": "Device",
"operator": "=",
"value": "DNS-RASP"
}
]
}
],
"thresholds": "",
"title": "Total Queries",
"type": "singlestat",
"valueFontSize": "80%",
"valueMaps": [
{
"op": "=",
"text": "N/A",
"value": "null"
}
],
"valueName": "avg"
}
],
"repeat": null,
"repeatIteration": null,
"repeatRowId": null,
"showTitle": false,
"title": "Dashboard Row",
"titleSize": "h6"
},
{
"collapse": false,
"height": 233,
"panels": [
{
"aliasColors": {},
"bars": true,
"dashLength": 10,
"dashes": false,
"datasource": "${DS_INFLUXDB}",
"editable": true,
"error": false,
"fill": 1,
"grid": {},
"hideTimeOverride": false,
"id": 17,
"interval": "",
"legend": {
"alignAsTable": true,
"avg": true,
"current": false,
"hideEmpty": false,
"max": false,
"min": false,
"rightSide": true,
"show": true,
"total": true,
"values": true
},
"lines": false,
"linewidth": 2,
"links": [],
"nullPointMode": "null",
"percentage": false,
"pointradius": 5,
"points": false,
"renderer": "flot",
"seriesOverrides": [],
"spaceLength": 10,
"span": 12,
"stack": false,
"steppedLine": false,
"targets": [
{
"alias": "Total Queries",
"dsType": "influxdb",
"groupBy": [
{
"params": [
"24h"
],
"type": "time"
},
{
"params": [
"0"
],
"type": "fill"
}
],
"measurement": "DNSStats",
"policy": "autogen",
"query": "SELECT sum(\"TotalQueryReceived\") FROM \"autogen\".\"DNSStats\" WHERE \"Device\" = 'DNS-RASP' AND $timeFilter GROUP BY time(1d,5h)",
"rawQuery": true,
"refId": "A",
"resultFormat": "time_series",
"select": [
[
{
"params": [
"TotalQueryReceived"
],
"type": "field"
},
{
"params": [],
"type": "sum"
}
]
],
"tags": [
{
"key": "Device",
"operator": "=",
"value": "DNS-RASP"
}
]
},
{
"alias": "Blocked Queries",
"dsType": "influxdb",
"groupBy": [
{
"params": [
"24h"
],
"type": "time"
},
{
"params": [
"0"
],
"type": "fill"
}
],
"measurement": "DNSStats",
"policy": "autogen",
"query": "SELECT sum(\"Blocked_Queries\") FROM \"autogen\".\"DNSStats\" WHERE \"Device\" = 'DNS-RASP' AND $timeFilter GROUP BY time(1d,5h)",
"rawQuery": true,
"refId": "B",
"resultFormat": "time_series",
"select": [
[
{
"params": [
"Blocked_Queries"
],
"type": "field"
},
{
"params": [],
"type": "sum"
}
]
],
"tags": [
{
"key": "Device",
"operator": "=",
"value": "DNS-RASP"
}
]
}
],
"thresholds": [],
"timeFrom": "30d",
"timeShift": null,
"title": "DNS Queries Per Day",
"tooltip": {
"msResolution": false,
"shared": true,
"sort": 0,
"value_type": "individual"
},
"transparent": false,
"type": "graph",
"xaxis": {
"buckets": null,
"mode": "time",
"name": null,
"show": true,
"values": []
},
"yaxes": [
{
"format": "none",
"label": "",
"logBase": 1,
"max": null,
"min": 0,
"show": true
},
{
"format": "bytes",
"label": "",
"logBase": 1,
"max": null,
"min": null,
"show": false
}
]
}
],
"repeat": null,
"repeatIteration": null,
"repeatRowId": null,
"showTitle": false,
"title": "Dashboard Row",
"titleSize": "h6"
},
{
"collapse": false,
"height": 245,
"panels": [
{
"aliasColors": {
"Free": "#7EB26D",
"In Use": "#EF843C",
"Standby Cache": "#6ED0E0",
"Used": "#E0F9D7"
},
"bars": false,
"dashLength": 10,
"dashes": false,
"datasource": "${DS_INFLUXDB}",
"editable": true,
"error": false,
"fill": 1,
"grid": {},
"id": 11,
"interval": ">60s",
"legend": {
"alignAsTable": true,
"avg": true,
"current": true,
"hideEmpty": false,
"hideZero": false,
"max": true,
"min": false,
"rightSide": true,
"show": true,
"sortDesc": true,
"total": false,
"values": true
},
"lines": true,
"linewidth": 2,
"links": [],
"nullPointMode": "null",
"percentage": false,
"pointradius": 5,
"points": false,
"renderer": "flot",
"seriesOverrides": [
{
"alias": "Used",
"color": "#CCA300",
"stack": true
},
{
"alias": "Free",
"color": "#7EB26D",
"stack": true
},
{
"alias": "Cache",
"color": "#64B0C8"
}
],
"spaceLength": 10,
"span": 6,
"stack": true,
"steppedLine": false,
"targets": [
{
"alias": "Used",
"dsType": "influxdb",
"groupBy": [],
"hide": false,
"measurement": "memoryStats",
"policy": "default",
"query": "SELECT mean(\"memUsed\") as Used FROM \"memoryStats\" WHERE \"Device\" = 'Scott-PC' AND $timeFilter GROUP BY time($interval) fill(null)",
"rawQuery": false,
"refId": "B",
"resultFormat": "time_series",
"select": [
[
{
"params": [
"memUsed"
],
"type": "field"
}
]
],
"tags": [
{
"key": "Device",
"operator": "=",
"value": "DNS-RASP"
}
]
},
{
"alias": "Cache",
"dsType": "influxdb",
"groupBy": [],
"measurement": "memoryStats",
"policy": "default",
"query": "SELECT mean(\"Standby_Cache_Core_Bytes\" )+ mean(\"Standby_Cache_Normal_Priority_Bytes\") + mean(\"Standby_Cache_Reserve_Bytes\") as Standby FROM \"win_mem\" WHERE \"host\" = 'Scott-PC' AND $timeFilter GROUP BY time($interval) fill(null)",
"rawQuery": false,
"refId": "C",
"resultFormat": "time_series",
"select": [
[
{
"params": [
"memCache"
],
"type": "field"
}
]
],
"tags": [
{
"key": "Device",
"operator": "=",
"value": "DNS-RASP"
}
]
},
{
"alias": "Free",
"dsType": "influxdb",
"groupBy": [],
"measurement": "memoryStats",
"policy": "default",
"query": "SELECT mean(\"Standby_Cache_Core_Bytes\" )+ mean(\"Standby_Cache_Normal_Priority_Bytes\") + mean(\"Standby_Cache_Reserve_Bytes\") as Standby FROM \"win_mem\" WHERE \"host\" = 'Scott-PC' AND $timeFilter GROUP BY time($interval) fill(null)",
"rawQuery": false,
"refId": "A",
"resultFormat": "time_series",
"select": [
[
{
"params": [
"memFree"
],
"type": "field"
}
]
],
"tags": [
{
"key": "Device",
"operator": "=",
"value": "DNS-RASP"
}
]
}
],
"thresholds": [],
"timeFrom": null,
"timeShift": null,
"title": "Memory Usage",
"tooltip": {
"msResolution": true,
"shared": true,
"sort": 0,
"value_type": "individual"
},
"type": "graph",
"xaxis": {
"buckets": null,
"mode": "time",
"name": null,
"show": true,
"values": []
},
"yaxes": [
{
"format": "kbytes",
"label": null,
"logBase": 1,
"max": null,
"min": 0,
"show": true
},
{
"format": "short",
"label": null,
"logBase": 1,
"max": null,
"min": null,
"show": false
}
]
},
{
"aliasColors": {},
"bars": false,
"dashLength": 10,
"dashes": false,
"datasource": "${DS_INFLUXDB}",
"decimals": 2,
"editable": true,
"error": false,
"fill": 1,
"grid": {},
"id": 10,
"legend": {
"alignAsTable": false,
"avg": false,
"current": false,
"max": false,
"min": false,
"show": true,
"total": false,
"values": false
},
"lines": true,
"linewidth": 2,
"links": [],
"nullPointMode": "connected",
"percentage": false,
"pointradius": 5,
"points": false,
"renderer": "flot",
"seriesOverrides": [
{
"alias": "Core 0 Temperature",
"color": "#EA6460",
"fill": 0,
"linewidth": 1,
"yaxis": 2
},
{
"alias": "Core 1 Temperature",
"color": "#EA6460",
"fill": 0,
"linewidth": 1,
"yaxis": 2
}
],
"spaceLength": 10,
"span": 6,
"stack": false,
"steppedLine": false,
"targets": [
{
"alias": "1m avg",
"dsType": "influxdb",
"groupBy": [
{
"params": [
"$interval"
],
"type": "time"
},
{
"params": [
"null"
],
"type": "fill"
}
],
"measurement": "cpuStats",
"policy": "default",
"refId": "B",
"resultFormat": "time_series",
"select": [
[
{
"params": [
"CPULoadAvg1m"
],
"type": "field"
},
{
"params": [],
"type": "mean"
}
]
],
"tags": [
{
"key": "Device",
"operator": "=",
"value": "DNS-RASP"
}
]
},
{
"alias": "5m avg",
"dsType": "influxdb",
"groupBy": [
{
"params": [
"$interval"
],
"type": "time"
},
{
"params": [
"null"
],
"type": "fill"
}
],
"measurement": "cpuStats",
"policy": "default",
"refId": "A",
"resultFormat": "time_series",
"select": [
[
{
"params": [
"CPULoadAvg5m"
],
"type": "field"
},
{
"params": [],
"type": "mean"
}
]
],
"tags": [
{
"key": "Device",
"operator": "=",
"value": "DNS-RASP"
}
]
},
{
"alias": "15m avg",
"dsType": "influxdb",
"groupBy": [
{
"params": [
"$interval"
],
"type": "time"
},
{
"params": [
"null"
],
"type": "fill"
}
],
"measurement": "cpuStats",
"policy": "default",
"refId": "C",
"resultFormat": "time_series",
"select": [
[
{
"params": [
"CPULoadAvg15m"
],
"type": "field"
},
{
"params": [],
"type": "mean"
}
]
],
"tags": [
{
"key": "Device",
"operator": "=",
"value": "DNS-RASP"
}
]
},
{
"alias": "Core 0 Temperature",
"dsType": "influxdb",
"groupBy": [
{
"params": [
"$interval"
],
"type": "time"
},
{
"params": [
"null"
],
"type": "fill"
}
],
"measurement": "CPUtempStats",
"policy": "default",
"refId": "D",
"resultFormat": "time_series",
"select": [
[
{
"params": [
"Temperature"
],
"type": "field"
},
{
"params": [],
"type": "mean"
}
]
],
"tags": [
{
"key": "Device",
"operator": "=",
"value": "DNS-RASP"
}
]
}
],
"thresholds": [
{
"colorMode": "custom",
"fill": true,
"fillColor": "rgba(216, 200, 27, 0.03)",
"op": "gt",
"value": 4
},
{
"colorMode": "custom",
"fill": true,
"fillColor": "rgba(234, 112, 112, 0.04)",
"op": "gt",
"value": 8
}
],
"timeFrom": null,
"timeShift": null,
"title": "CPU Load Average",
"tooltip": {
"msResolution": false,
"shared": true,
"sort": 0,
"value_type": "cumulative"
},
"type": "graph",
"xaxis": {
"buckets": null,
"mode": "time",
"name": null,
"show": true,
"values": []
},
"yaxes": [
{
"format": "short",
"label": null,
"logBase": 1,
"max": null,
"min": null,
"show": true
},
{
"format": "celsius",
"label": null,
"logBase": 1,
"max": null,
"min": null,
"show": true
}
]
}
],
"repeat": null,
"repeatIteration": null,
"repeatRowId": null,
"showTitle": false,
"title": "Memory/CPU",
"titleSize": "h6"
},
{
"collapse": false,
"height": "250px",
"panels": [
{
"aliasColors": {
"Download": "#7EB26D",
"Upload": "#6ED0E0",
"test.derivative {interface: }": "#6ED0E0"
},
"bars": false,
"dashLength": 10,
"dashes": false,
"datasource": "${DS_INFLUXDB}",
"editable": true,
"error": false,
"fill": 1,
"grid": {},
"id": 2,
"interval": ">60s",
"legend": {
"alignAsTable": true,
"avg": true,
"current": true,
"hideEmpty": false,
"hideZero": false,
"max": false,
"min": false,
"rightSide": true,
"show": true,
"total": false,
"values": true
},
"lines": true,
"linewidth": 2,
"links": [],
"nullPointMode": "null",
"percentage": false,
"pointradius": 5,
"points": false,
"renderer": "flot",
"seriesOverrides": [
{
"alias": "Upload",
"transform": "negative-Y"
}
],
"spaceLength": 10,
"span": 10,
"stack": false,
"steppedLine": false,
"targets": [
{
"alias": "Download",
"dsType": "influxdb",
"groupBy": [
{
"params": [
"auto"
],
"type": "time"
},
{
"params": [
"null"
],
"type": "fill"
}
],
"measurement": "interfaceStats",
"policy": "default",
"refId": "A",
"resultFormat": "time_series",
"select": [
[
{
"params": [
"bytesIn"
],
"type": "field"
},
{
"params": [],
"type": "sum"
},
{
"params": [
" / 60"
],
"type": "math"
}
]
],
"tags": [
{
"key": "Device",
"operator": "=",
"value": "DNS-RASP"
},
{
"condition": "AND",
"key": "Interface",
"operator": "=",
"value": "eth0"
}
]
},
{
"alias": "Upload",
"dsType": "influxdb",
"groupBy": [
{
"params": [
"auto"
],
"type": "time"
},
{
"params": [
"null"
],
"type": "fill"
}
],
"measurement": "interfaceStats",
"policy": "default",
"refId": "C",
"resultFormat": "time_series",
"select": [
[
{
"params": [
"bytesOut"
],
"type": "field"
},
{
"params": [],
"type": "sum"
},
{
"params": [
" /60"
],
"type": "math"
}
]
],
"tags": [
{
"key": "Device",
"operator": "=",
"value": "DNS-RASP"
},
{
"condition": "AND",
"key": "Interface",
"operator": "=",
"value": "eth0"
}
]
}
],
"thresholds": [],
"timeFrom": null,
"timeShift": null,
"title": "Interface Traffic",
"tooltip": {
"msResolution": true,
"shared": true,
"sort": 0,
"value_type": "cumulative"
},
"type": "graph",
"xaxis": {
"buckets": null,
"mode": "time",
"name": null,
"show": true,
"values": []
},
"yaxes": [
{
"format": "bytes",
"label": null,
"logBase": 1,
"max": null,
"min": null,
"show": true
},
{
"format": "bytes",
"label": null,
"logBase": 1,
"max": null,
"min": null,
"show": false
}
]
},
{
"cacheTimeout": null,
"colorBackground": false,
"colorValue": false,
"colors": [
"rgba(245, 54, 54, 0.9)",
"rgba(237, 129, 40, 0.89)",
"rgba(50, 172, 45, 0.97)"
],
"datasource": "${DS_INFLUXDB}",
"editable": true,
"error": false,
"format": "bytes",
"gauge": {
"maxValue": 100,
"minValue": 0,
"show": false,
"thresholdLabels": false,
"thresholdMarkers": false
},
"height": "120",
"id": 8,
"interval": "",
"links": [],
"mappingType": 1,
"mappingTypes": [
{
"name": "value to text",
"value": 1
},
{
"name": "range to text",
"value": 2
}
],
"maxDataPoints": 100,
"nullPointMode": "connected",
"nullText": null,
"postfix": "",
"postfixFontSize": "50%",
"prefix": "",
"prefixFontSize": "50%",
"rangeMaps": [
{
"from": "null",
"text": "N/A",
"to": "null"
}
],
"span": 2,
"sparkline": {
"fillColor": "rgba(31, 118, 189, 0.18)",
"full": false,
"lineColor": "rgb(31, 120, 193)",
"show": true
},
"tableColumn": "",
"targets": [
{
"dsType": "influxdb",
"groupBy": [],
"measurement": "interfaceStats",
"policy": "default",
"query": "SELECT sum(\"inBytes\") FROM \"test\"",
"rawQuery": false,
"refId": "A",
"resultFormat": "time_series",
"select": [
[
{
"params": [
"bytesIn"
],
"type": "field"
},
{
"params": [],
"type": "sum"
}
]
],
"tags": [
{
"key": "Device",
"operator": "=",
"value": "DNS-RASP"
},
{
"condition": "AND",
"key": "Interface",
"operator": "=",
"value": "eth0"
}
]
}
],
"thresholds": "",
"title": "Download",
"type": "singlestat",
"valueFontSize": "100%",
"valueMaps": [
{
"op": "=",
"text": "N/A",
"value": "null"
}
],
"valueName": "avg"
},
{
"cacheTimeout": null,
"colorBackground": false,
"colorValue": false,
"colors": [
"rgba(245, 54, 54, 0.9)",
"rgba(237, 129, 40, 0.89)",
"rgba(50, 172, 45, 0.97)"
],
"datasource": "${DS_INFLUXDB}",
"editable": true,
"error": false,
"format": "bytes",
"gauge": {
"maxValue": 100,
"minValue": 0,
"show": false,
"thresholdLabels": false,
"thresholdMarkers": false
},
"height": "120",
"id": 9,
"interval": "",
"links": [],
"mappingType": 1,
"mappingTypes": [
{
"name": "value to text",
"value": 1
},
{
"name": "range to text",
"value": 2
}
],
"maxDataPoints": 100,
"nullPointMode": "connected",
"nullText": null,
"postfix": "",
"postfixFontSize": "50%",
"prefix": "",
"prefixFontSize": "50%",
"rangeMaps": [
{
"from": "null",
"text": "N/A",
"to": "null"
}
],
"span": 2,
"sparkline": {
"fillColor": "rgba(31, 118, 189, 0.18)",
"full": false,
"lineColor": "rgb(31, 120, 193)",
"show": true
},
"tableColumn": "",
"targets": [
{
"dsType": "influxdb",
"groupBy": [],
"measurement": "interfaceStats",
"policy": "default",
"query": "SELECT sum(\"inBytes\") FROM \"test\"",
"rawQuery": false,
"refId": "A",
"resultFormat": "time_series",
"select": [
[
{
"params": [
"bytesOut"
],
"type": "field"
},
{
"params": [],
"type": "sum"
}
]
],
"tags": [
{
"key": "Device",
"operator": "=",
"value": "DNS-RASP"
},
{
"condition": "AND",
"key": "Interface",
"operator": "=",
"value": "eth0"
}
]
}
],
"thresholds": "",
"title": "Upload",
"type": "singlestat",
"valueFontSize": "100%",
"valueMaps": [
{
"op": "=",
"text": "N/A",
"value": "null"
}
],
"valueName": "avg"
}
],
"repeat": null,
"repeatIteration": null,
"repeatRowId": null,
"showTitle": false,
"title": "Network Interface",
"titleSize": "h6"
},
{
"collapse": false,
"height": "200px",
"panels": [
{
"cacheTimeout": null,
"colorBackground": false,
"colorValue": false,
"colors": [
"rgba(50, 172, 45, 0.97)",
"rgba(237, 129, 40, 0.89)",
"rgba(245, 54, 54, 0.9)"
],
"datasource": "${DS_INFLUXDB}",
"editable": true,
"error": false,
"format": "percent",
"gauge": {
"maxValue": 100,
"minValue": 0,
"show": true,
"thresholdLabels": false,
"thresholdMarkers": true
},
"hideTimeOverride": true,
"id": 4,
"interval": null,
"links": [],
"mappingType": 1,
"mappingTypes": [
{
"name": "value to text",
"value": 1
},
{
"name": "range to text",
"value": 2
}
],
"maxDataPoints": 100,
"nullPointMode": "connected",
"nullText": null,
"postfix": "",
"postfixFontSize": "50%",
"prefix": "",
"prefixFontSize": "50%",
"rangeMaps": [
{
"from": "null",
"text": "N/A",
"to": "null"
}
],
"span": 2,
"sparkline": {
"fillColor": "rgba(31, 118, 189, 0.18)",
"full": false,
"lineColor": "rgb(31, 120, 193)",
"show": false
},
"tableColumn": "",
"targets": [
{
"dsType": "influxdb",
"groupBy": [],
"measurement": "drive_spaceStats",
"policy": "default",
"refId": "A",
"resultFormat": "time_series",
"select": [
[
{
"params": [
"Utilization"
],
"type": "field"
},
{
"params": [],
"type": "last"
}
]
],
"tags": [
{
"key": "Device",
"operator": "=",
"value": "DNS-RASP"
},
{
"condition": "AND",
"key": "Drive",
"operator": "=",
"value": "SD"
}
]
}
],
"thresholds": "75,90",
"timeFrom": "7d",
"timeShift": null,
"title": "SD",
"type": "singlestat",
"valueFontSize": "80%",
"valueMaps": [
{
"op": "=",
"text": "N/A",
"value": "null"
}
],
"valueName": "current"
},
{
"aliasColors": {},
"bars": false,
"dashLength": 10,
"dashes": false,
"datasource": "${DS_INFLUXDB}",
"editable": true,
"error": false,
"fill": 1,
"grid": {},
"id": 3,
"interval