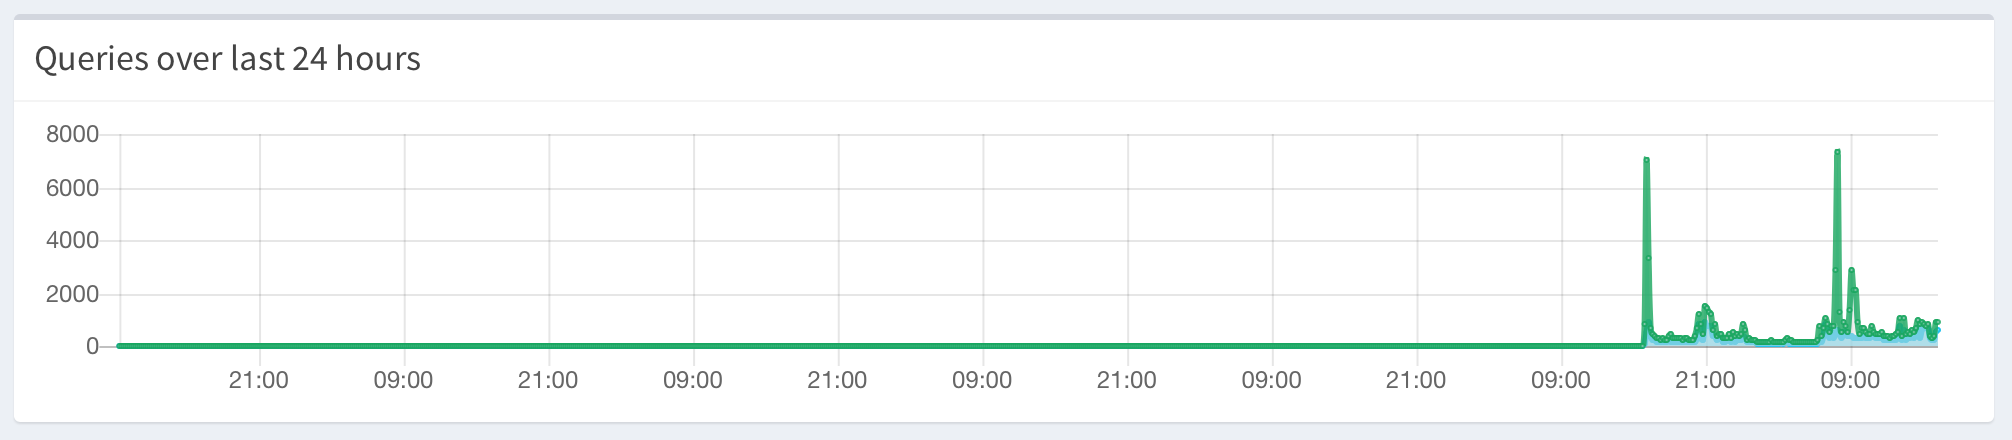
Running the FTL dev version and expecting to see hour increments on the 24 hour graph.
Hour axis only shows 21:00 and 9:00 as per the screenshot.
pq56iu904a
Mcat12
July 14, 2018, 8:44pm
2
I read that before posting and think that the proposed issue/resolution doesn't apply. I set my pi up a few weeks ago, and I tested accessing the interface from my Mac and iPhone with same results. So i know it is not the browser clock and I know it can't be the Pi clock.
The pi was configured for the EDT TZ when I set it up weeks ago and my iPhone and Mac get time via NTP.
Mcat12
July 14, 2018, 9:10pm
4
What is the output of this command?
echo ">ClientsoverTime" | nc localhost 4711 | tail
It should return some timestamps and numbers. Check that the timestamps are not in the future.
I let it run for a while but get no output.
pi@strat0varius:~ $ date
Sat Jul 14 21:13:12 EDT 2018
pi@strat0varius:~ $ echo ">ClientsoverTime" | nc localhost 4711 | tail

^C
pi@strat0varius:~ $ date
Sat Jul 14 21:14:22 EDT 2018
pi@strat0varius:~ $
Did a netstat to see if I have anything listening on 4711 but don't see anything.
pi@strat0varius:~ $ sudo netstat -nlup
pi@strat0varius:~ $
Mcat12
July 15, 2018, 2:41am
6
Your second command shows that it is listening on 127.0.0.1 and ::1 (IPv6 localhost). Try using 127.0.0.1 instead of localhost.
I missed that line. Tried 127.0.0.1, no change. Also checked to see if localhost resolves and it does.
pi@strat0varius:~ $ echo ">ClientsoverTime" | nc 127.0.0.1 4711 | tail
Mcat12
July 15, 2018, 4:56pm
8
Anything interesting in FTL's log?
tail /var/log/pihole-FTL.log
Nope, not as far as I can tell.sudo service pihole-FTL restart
Based on this behavior and the other user's experienced behavior...I wonder if it is a bug with the dev FTL version.
Mcat12
July 20, 2018, 1:20am
10
If you're able to reproduce the issue, share the full FTL log.
system
August 10, 2018, 1:20am
11
This topic was automatically closed 21 days after the last reply. New replies are no longer allowed.