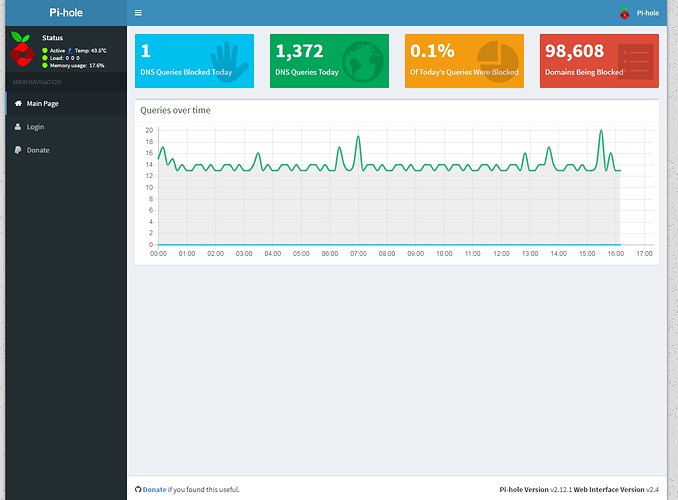
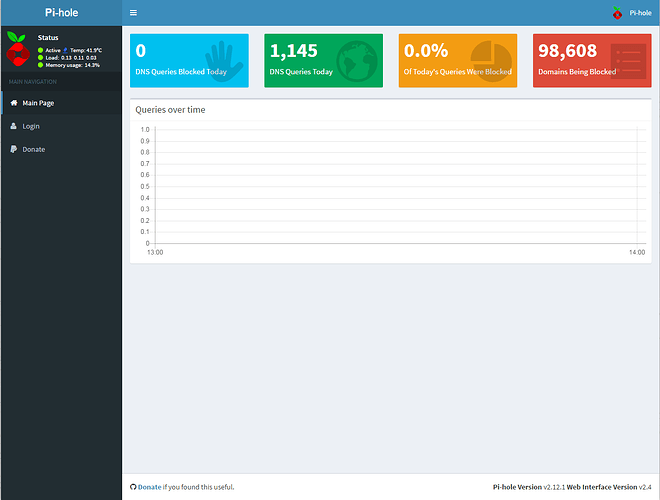
When no DNS queries are blocked -> empty graph

Hi,
I have a perfectly good working P-hole installation. It is blocking DNS queries when it should. However, when I am a few days from home I noticed that the graph stays empty. There are no blocked DNS queries (nobody is at home) but some devices do DNS queries which are ok. The moment I come home and start browsing the internet, the number of blocked queries increases, ads are blocked as it should be and the graph is showing again... I suspect the graph is not showing properly when the number of blocked DNS queries = 0...

Regards, Jan
What's the output of curl http://pi.hole/admin/api.php?overTimeData10mins?

The output is:

{"domains_over_time":[15,17,14,15,13,14,13,13,14,14,13,14,13,13,14,14,13,14,13,13,14,16,13,14,13,13,14,14,13,14,13,13,14,14,13,14,13,13,17,14,13,14,19,13,14,14,13,14,13,13,14,14,13,14,13,13,14,14,13,14,14,13,14,14,13,14,13,13,14,14,13,14,13,13,14,14,13,16,13,13,14,14,17,14,13,13,14,14,13,14,13,13,14,20,13,16],"ads_over_time":{"1":0}}

Run pihole -d for a debug token.

debug token is 5fzdpbs1ib

But the strange thing is: after the pihole -d I do now have a graph... You may analyse it but it's also ok to leave it. I'll experiment the coming days with this.

Regards, Jan

The debug script does check if ads are being blocked by getting the IP address of doubleclick.com, so it would have added one to the number of blocked queries.

It did.. blocked domains is now 1. I am still not at home, working remotely on the Pi at the moment.

I'm still looking into this, btw. Just haven't had too much time over the weekend.

Ok, no hurries... I experimented a little further with this: I was not a home this weekend (nobody home) so there were no blocked DNS requests. As I have several online devices in my home there were still DNS request going out. The Pi-hole admin page and Pi is remotely accesible (by me :slight_smile: ), I could see that after midnight the graph disappeared; in the 'dns queries today' block I could see the number increasing, while the graph only showed a period of one hour with 0 dns requests (the same as in my opening post). Then I vpn'ed to my Pi, issued a pihole -d command et voila, the graph returned correctly with the number of dns requests and 1 blocked request (doubleclick.com). So my guess is that after midnight (after flushing or rollover of logs) the graph is not displaying correctly until at least 1 DNS request is blocked. Maybe you should do a scheduled dns request to doubleclick.com every day at 00:01 :slight_smile:

Regards, Jan

So your installation is working properly, but it sounds like maybe you discovered a minor bug: the graph doesn't display until at least one ad is blocked?

Correct. The graph displays as posted in my opening post until at least 1 dns query is blocked. The numbers in at the top in the ' dns queries blocked today' and 'dns queries today' are correct though, but these numbers are not showing in the graph and the graph is only showing a period of 1 hour. Apart from this, pihole is working perfectly, no complaints about that :slight_smile:

Regards, Jan

I suppose I have never run into this since ads are so prevalent, that I tend to have at least something blocked.

I will see if I can replicate this and then submit a bug report.

Thanks. I only discovered it because I was a few days from home so at home ther were no ads to be blocked (and because I looked at the admin page when I was not at home).

Rgrds, Jan

A post was split to a new topic: Zero DNS queries