BoBo
July 24, 2025, 7:11am
1
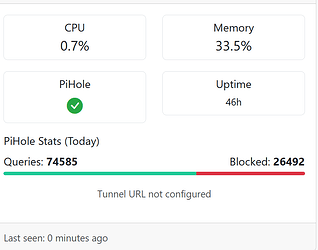
Hi! I have been working with the Pi-hole API and have noticed some discrepancies in the data. I have posted 2 photos:
One of the Web UI
One of my online portal to show the discrepancies
Pi-hole Web UI:
My Online Portal:
The discrepancy seems to be exponential - as the number of queries increases, the discrepancy increases proportionally. Each picture is taken within seconds of each other.
Timezone: Central (America/Chicago)API Endpoint: /api/stats/database/summary
I have also uploaded the portion of code that is responsible for setting up this API call:
# Get current time in Chicago timezone for Pi-hole API.
local_now = datetime.now() # Chicago timezone
local_day_ago = local_now - timedelta(days=1) # Chicago timezone

# Convert to UTC assuming local_now is local time
now_utc = local_now.astimezone(timezone.utc)
day_ago_utc = local_day_ago.astimezone(timezone.utc)

# Convert to unix timestamps
now = int(now_utc.timestamp())
day_ago = int(day_ago_utc.timestamp())

stats_url = f"{PIHOLE_HOST}/api/stats/database/summary?from={day_ago}&until={now}"
sys_url = f"{PIHOLE_HOST}/api/info/system"

try:
    # Get DNS stats
    stats_resp = requests.get(stats_url, headers=headers, timeout=5, verify=False)
    stats_resp.raise_for_status()
    stats_data = stats_resp.json()

    queries_today = stats_data.get("sum_queries", 0)
    blocked_today = stats_data.get("sum_blocked", 0)
Any help would be greatly appreciated!
I can confirm seeing different results for API and UI.
When analysing the (then) most recent 10 minute time slot, the UI showed 34 queries, whereas the API lookup returned a count of just 24.
curl -X GET "http://pi.hole:80/api/stats/database/summary?from=1753347600&until=1753348200" \
 -H 'accept: application/json'

{"sum_queries":24,"sum_blocked":2,"percent_blocked":8.3333330154418945,"total_clients":3,"took":0.0057270526885986328}
I then discovered that the UI shows database ids that are missing when querying the database directly.
The UI had this information:
Time
Query Status
Database ID
Type
Domain
Client
Reply Time
2025-07-24 11:09:09
served from cache
5789126
AAAA
discourse.pi-hole.net
desktop-pc
85.8 µs
2025-07-24 11:09:09
served from cache
5789127
A
discourse.pi-hole.net
desktop-pc
0.1 ms
2025-07-24 11:08:08
served from cache
5789124
AAAA
discourse.pi-hole.net
desktop-pc
89.9 µs
2025-07-24 11:08:08
served from cache
5789125
A
discourse.pi-hole.net
desktop-pc
0.1 ms
2025-07-24 11:07:05
served from cache
5789122 AAAA
discourse.pi-hole.net
desktop-pc
96.8 µs
2025-07-24 11:07:05
served from cache
5789123 A
discourse.pi-hole.net
desktop-pc
0.2 ms
2025-07-24 11:06:40
blocked
5789120
AAAA
mtalk.google.com
desktop-pc
81.8 µs
2025-07-24 11:06:40
blocked
5789121
A
mtalk.google.com
desktop-pc
0.3 ms
2025-07-24 11:06:05
served from cache
5789118 AAAA
discourse.pi-hole.net
desktop-pc
84.4 µs
2025-07-24 11:06:05
served from cache
5789119 A
discourse.pi-hole.net
desktop-pc
0.1 ms
2025-07-24 11:05:29
served by cache optimizer
5789116
AAAA
github.com
desktop-pc
0.1 ms
2025-07-24 11:05:29
served by cache optimizer
5789117
A
github.com
desktop-pc
0.1 ms
2025-07-24 11:05:27
served by cache optimizer
5789114 AAAA
alive.github.com
desktop-pc
0.1 ms
2025-07-24 11:05:27
served by cache optimizer
5789115 A
alive.github.com
desktop-pc
0.1 ms
2025-07-24 11:05:04
served from cache
5789112 AAAA
discourse.pi-hole.net
desktop-pc
85.4 µs
2025-07-24 11:05:04
served from cache
5789113 A
discourse.pi-hole.net
desktop-pc
0.2 ms
2025-07-24 11:04:03
served from cache
5789110 AAAA
discourse.pi-hole.net
desktop-pc
85.6 µs
2025-07-24 11:04:03
served from cache
5789111 A
discourse.pi-hole.net
desktop-pc
0.1 ms
2025-07-24 11:03:02
served from cache
5789108
AAAA
discourse.pi-hole.net
desktop-pc
85.4 µs
2025-07-24 11:03:02
served from cache
5789109
A
discourse.pi-hole.net
desktop-pc
0.1 ms
2025-07-24 11:02:01
served from cache
5789106
AAAA
discourse.pi-hole.net
desktop-pc
87.3 µs
2025-07-24 11:02:01
served from cache
5789107
A
discourse.pi-hole.net
desktop-pc
0.1 ms
2025-07-24 11:01:00
served from cache
5789104
AAAA
discourse.pi-hole.net
desktop-pc
84.4 µs
2025-07-24 11:01:00
served from cache
5789105
A
discourse.pi-hole.net
desktop-pc
0.1 ms
2025-07-24 11:00:28
forwarded
5789101
DS
github.com
pi.hole
51.6 ms
2025-07-24 11:00:27
served from cache
5789102
AAAA
alive.github.com
desktop-pc
0.1 ms
2025-07-24 11:00:27
forwarded
5789103
A
alive.github.com
desktop-pc
109.6 ms
2025-07-24 11:00:00
served from cache
5789094
PTR
1.1.168.192.in-addr.arpa
localhost
0.2 ms
2025-07-24 11:00:00
served from cache
5789095
PTR
1.1.0.127.in-addr.arpa
localhost
0.2 ms
2025-07-24 11:00:00
served by cache optimizer
5789096
PTR
32.1.168.192.in-addr.arpa
localhost
0.2 ms
2025-07-24 11:00:00
served from cache
5789097
PTR
1.1.168.192.in-addr.arpa
localhost
0.2 ms
2025-07-24 11:00:00
served from cache
5789098
PTR
2.17.47.10.in-addr.arpa
localhost
0.1 ms
2025-07-24 11:00:00
served from cache
5789099
PTR
1.0.0.127.in-addr.arpa
localhost
0.4 ms
2025-07-24 11:00:00
served by cache optimizer
5789100
PTR
11.1.168.192.in-addr.arpa
localhost
0.2 ms
The database returns this:
date && sudo pihole-FTL sqlite3 /etc/pihole/pihole-FTL.db  \
"SELECT id, datetime(timestamp,'unixepoch','localtime'),domain  \
FROM queries WHERE id BETWEEN 5789094 AND 5789127  \
ORDER BY timestamp DESC;"

Thu 24 Jul 2025 13:12:29 CEST
5789126|2025-07-24 11:09:09|discourse.pi-hole.net
5789127|2025-07-24 11:09:09|discourse.pi-hole.net
5789124|2025-07-24 11:08:08|discourse.pi-hole.net
5789125|2025-07-24 11:08:08|discourse.pi-hole.net
5789120|2025-07-24 11:06:40|mtalk.google.com
5789121|2025-07-24 11:06:40|mtalk.google.com
5789116|2025-07-24 11:05:29|github.com
5789117|2025-07-24 11:05:29|github.com
5789108|2025-07-24 11:03:02|discourse.pi-hole.net
5789109|2025-07-24 11:03:02|discourse.pi-hole.net
5789106|2025-07-24 11:02:01|discourse.pi-hole.net
5789107|2025-07-24 11:02:01|discourse.pi-hole.net
5789104|2025-07-24 11:01:00|discourse.pi-hole.net
5789105|2025-07-24 11:01:00|discourse.pi-hole.net
5789101|2025-07-24 11:00:28|github.com
5789102|2025-07-24 11:00:27|alive.github.com
5789103|2025-07-24 11:00:27|alive.github.com
5789094|2025-07-24 11:00:00|1.127.168.192.in-addr.arpa
5789095|2025-07-24 11:00:00|1.1.0.127.in-addr.arpa
5789096|2025-07-24 11:00:00|32.127.168.192.in-addr.arpa
5789097|2025-07-24 11:00:00|1.127.168.192.in-addr.arpa
5789098|2025-07-24 11:00:00|2.17.47.10.in-addr.arpa
5789099|2025-07-24 11:00:00|1.0.0.127.in-addr.arpa
5789100|2025-07-24 11:00:00|11.127.168.192.in-addr.arpa
I've marked the missing IDs in the UI output above.
@DL6ER , it would seem that Pi-hole missed writing records to its database.
1 Like
BoBo
July 24, 2025, 7:47pm
3
Thank you so much for confirming this!
That's probably exactly what's causing the discrepancy I'm seeing. The missing database IDs would explain why the API returns fewer queries than the Web UI - the API is only counting what actually made it into the database.
Appreciate you taking the time to dig into this with the direct database queries! Please let me know if/when a solution becomes available.
This may be difficult to analyse and fix in case it should not be easily reproducible.
When looking at my logs, it would seem the IDs that didn't make it into the database are occurring in roughly 60 second intervals.
60 seconds would be Pi-hole's default interval to commit new queries to its database.
However, in my case, that interval has been changed:
~$ sudo pihole-FTL --config database.DBinterval
90
I wonder whether that could contribute to certain queries missing out on being stored.
But let's see if @DL6ER is able to reproduce our observations.
DL6ER
July 25, 2025, 5:33pm
5
Fortunately, not.
It is actually much simpler to reproduce this: Just go to https://pi.hole/admin/queries and select any time interval. Then try once with the database checkbox checked (will only query the database) and one unchecked (will only query the internal database).
I just saw in a quick test for an hour ago:
on-disk: 446
internal: 504
The on-disk number is identical with the number returned by the corresponding /api/stats/database/summary?from=...&to=... call.
When we add new queries to the database, we memorize how many were inserted and don't insert them again next time to lower database I/O. Now, this counter of already added queries gets updated (correct) and then gets incremented by the number of insertions a second time (incorrect). Hence, too many queries are skipped in the next following insertion round.
This fix is super simple (just remove redundant code) and currently running for validation purposes on my local Pi-hole. If you want to join in on verifying it works, please run
sudo pihole checkout ftl fix/insertion_counting
development ← fix/insertion_counting
opened 05:32PM - 25 Jul 25 UTC
# What does this implement/fix?
Avoid double-incrementing the `last_disk_db_i… dx` counter. This leads to a situation where some queries are not stored in the on-disk database. How much this affects you depends on the activity of the aforegoing database storing interval and, hence, is rather subtle.
---
**Related issue or feature (if applicable):** https://discourse.pi-hole.net/t/web-ui-and-api-show-different-query-block-totals-database-summary-discrepancy/81359
**Pull request in [docs](https://github.com/pi-hole/docs) with documentation (if applicable):** N/A
---
**By submitting this pull request, I confirm the following:**
1. I have read and understood the [contributors guide](https://docs.pi-hole.net/guides/github/contributing/), as well as this entire template. I understand which branch to base my commits and Pull Requests against.
2. I have commented my proposed changes within the code.
3. I am willing to help maintain this change if there are issues with it later.
4. It is compatible with the [EUPL 1.2 license](https://opensource.org/licenses/EUPL-1.1)
5. I have squashed any insignificant commits. ([`git rebase`](http://gitready.com/advanced/2009/02/10/squashing-commits-with-rebase.html))
## Checklist:
- [x] The code change is tested and works locally.
- [x] I based my code and PRs against the repositories `development` branch.
- [x] I [signed off](https://docs.pi-hole.net/guides/github/how-to-signoff/) all commits. Pi-hole enforces the [DCO](https://docs.pi-hole.net/guides/github/dco/) for all contributions
- [x] I [signed](https://docs.github.com/en/authentication/managing-commit-signature-verification/signing-commits) all my commits. Pi-hole requires signatures to verify authorship
- [x] I have read the above and my PR is ready for review.
Anyone wanting to test that, the command is:
sudo pihole checkout ftl fix/insertion_counting
Just installed...pihole is still working
Will watch a movie for the next 2hours and then take a look at the statistics.
DL6ER
July 29, 2025, 6:21pm
8
Do you have any feedback for us four days later?
BoBo
July 29, 2025, 6:36pm
9
Yes! Sorry for not getting back sooner. It was working really well the metrics were super close, but now a couple days later. It seems to be way off again. I am going to run some more test could just be me messing up the API call.
DL6ER
August 10, 2025, 8:25am
10
This is really odd. I am running the tests for over two weeks myself now and everything seems to be perfectly in sync.


