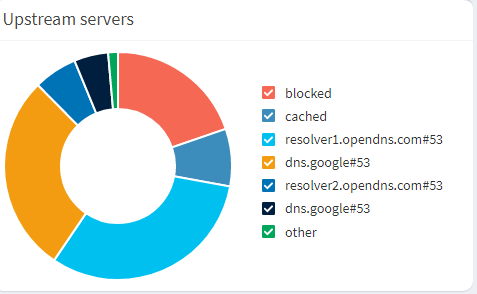
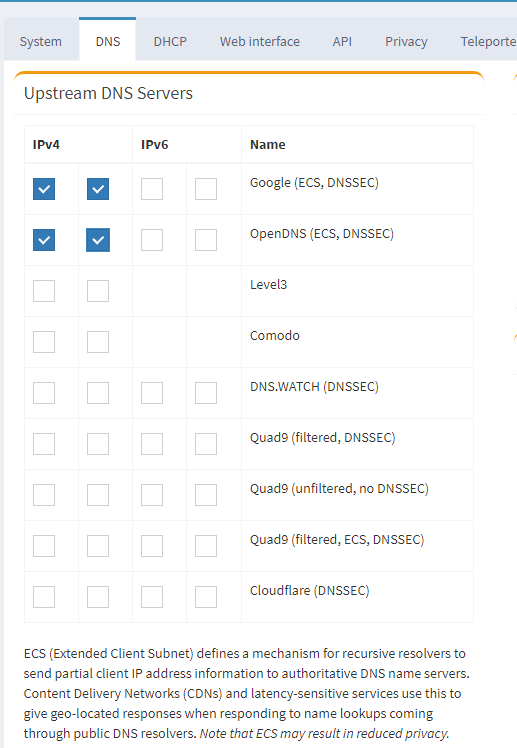
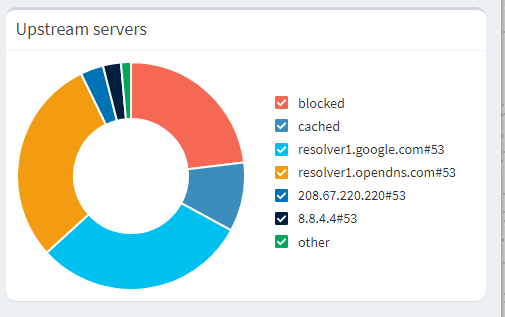
As can be seen from image (Upstream servers), I would like to ask how to distinguish which google servers are being used (colour representation/display from graph), i.e., 8.8.8.8 and or 8.8.4.4? The hover help only displays which is displayed in the graph. Also note for the open dns servers at least there is a distinction between resolver 1 and 2 which I can tie back to the Upstream DNS Servers setting page via hover help to display the IP address of the DNS, where I am assuming resolver 1 is the first selected from the left hand side...
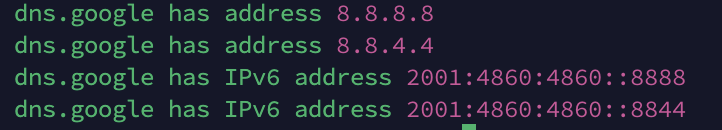
This is because both IP addresses 8.8.8.8 or 8.8.4.4 share the same host name "dns.google" This is how Google has set them up, pihole just shows hostnames of the IP addresses that you set as upstream DNS servers
Thanks for the reply and that information, which is good to know, so from a GUI/Graph representation perspective, is there any way to display this via the GUI/Graph, knowing this information is available via the data base as per @chrislph suggestion? A question for the developers..
Thanks for reply, good information to know, but for me in terms of the graph, at least in my case makes the graph display not so useful when it comes to the google servers as you are unsure which google server is the fastest in terms of DNS requests/replies, unless you run a command line query to determine this.
Agreed, it would be handy to be able to see IPs, in my case more for debugging stuff. Maybe like a new setting in Settings > Web interface > Per Browser Settings such as
[x] Show IPs on Dashboard Upstream servers
or maybe there is a way to enable it in a conf file settings (I couldn't find one though)
Great suggestion for the developers, I for one 100% agree. I would prefer to see an IP address rather than a host name of the upstream DNS servers. As you suggest an option being available to users would be fantastic.
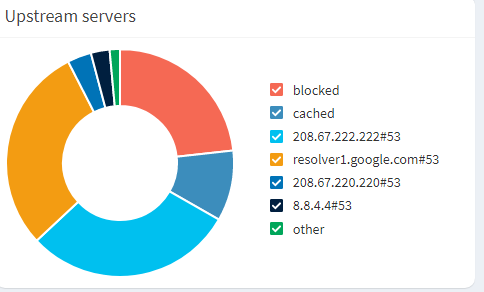
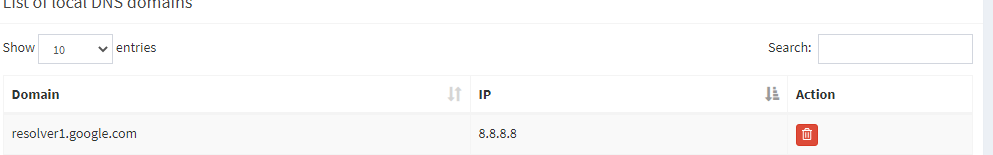
It's not generally advisable to do this for public IPs, but in this special instance, creating a Local DNS Record for one (or both) of Google's addresses should result in the desired distinction in Pi-holes dashboard.
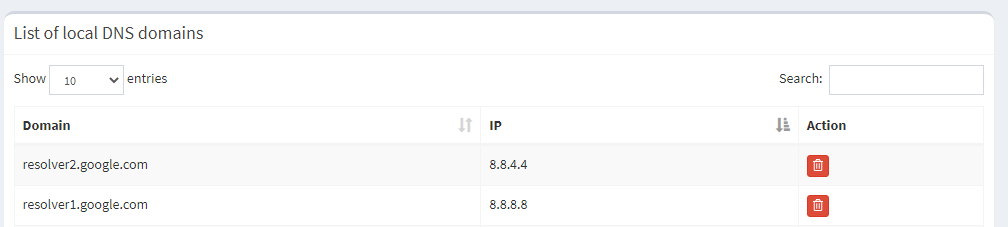
The naming conventions of open DNS are now showing IP addresses and the other google server is showing an IP address as well.. Is that suuposed to happen?
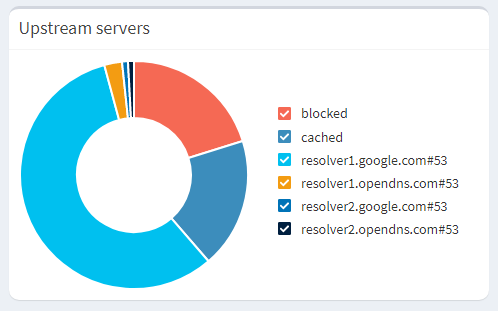
Looks ok to me:
Your screenshot shows Google's upstreams now appear by different labels.
Adjust the label names via Local DNS Records as you prefer them to appear.
The API shows that the info is captured and recorded by IP, so might there be a way to have it natively on the dashboard? Eg a custom hack in the code that pulls the IP instead of (or as well as) the names? I actually thought it was already but I was thinking of the tooltips over the DNS checkboxes.
Maybe only one has been used since you made the change. Force them one at a time by unticking the second IPv4 Google DNS server in Settings > DNS and saving changes, and then visiting a couple of sites, then going back to the settings, unticking the first one and ticking the second one and saving changes, and then visit a couple of other sites.
Then take another look at the dashboard – is it displaying both of your custom names?
Finally, go back to the settings and ticking both again for normal use and saving changes.
Possibly the percentage generated during a short test is a fraction of a percent and after a few minutes it's essentially zero. In my stats example above the second Google server had a percentage of 0.02% after a minute of testing, and a few minutes after I posted that it had gone from the dashboard.