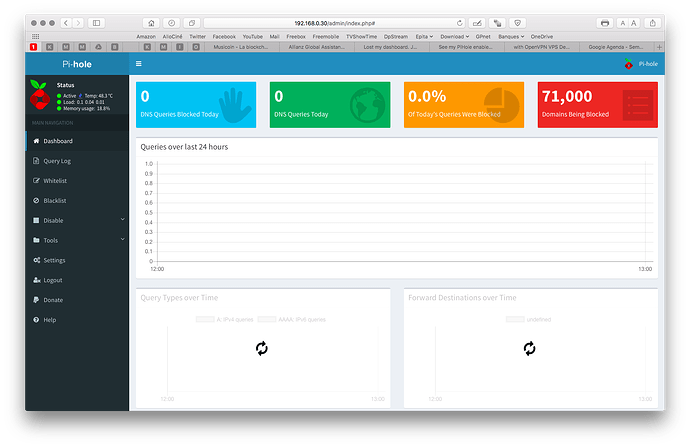
Hi, I've the same problem here with the same configuration but your solution didn't work. Anyone could help me please? thank you in advance !
Which browser? Which operating system? Can you try different browsers and/or different client devices?
I used safari and firefox on macos 10.12.6 beta 2, both show the same result as you can see
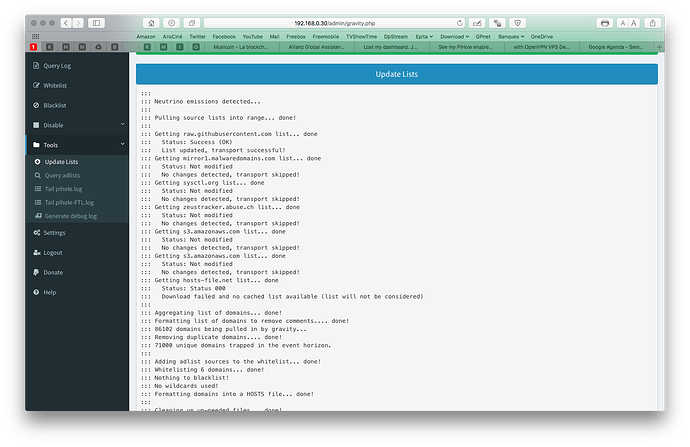
Also i would like to point something, when updating the gravity list this is what happen :
On Mac the keys you would have to press are different, but I don't think that this matters here. It seems like the backend is working as expected (you see the zero statistics on the dashboard) and the lack of displayed data is due to the fact that there is nothing to display (because of zero queries!).
Point some devices to your Pi-hole's DNS server to generate some data to be analyzed so you can see something on your dashboard.
Concerning the error in the gravity update: This is something I can confirm - it seems like the host is down (that happens from time to time).
I already configured my pi to be my central dns over my private network and it still is, until the last update it was working.
⌘+R will force refresh the browser on a Mac. Also, flush your cache and then make sure the Pi-hole has some queries. Let us know if that works.
However, it says that there are zero entries in to log. Please generate a debug log using pihole -d and upload it + provide the token.
I reinstalled everything from the bash , not updated it and it worked. don't know what was the problem but it is solved, thank you all !
Would love some help debugging the same issue.
I've tried:
- Hard refresh of browser cache on chrome
- tailing logs via pihole -t (lots of dnsmasq lines running indicating pihole itself is working)
- checked the permissions of the pihole log (644)
I installed the v3.2.1 tag of pihole as the latest version had issues with dnsmasq on my Jessie os. (Suggestion courtesy of another thread here on this forum and the latest blog post I found):
cd /etc/.pihole
sudo git checkout v3.2.1
cd /var/www/html/admin
sudo git checkout v3.2.1
pihole -r
pihole checkout ftl v2.13.2
My debug token is g9loyifu4h
Thanks for your help.
So you see no stats at all in the web interface? If you open the browser dev tools (F12), do you see any errors in the console? Also, what's the output of these commands?
echo ">stats" | nc localhost 4711
curl http://localhost/admin/api.php?summary
Hi Mcat12,
Here are my findings. Dev console has no errors.
$ echo ">stats" | nc localhost 4711
domains_being_blocked 118745
dns_queries_today 0
ads_blocked_today 0
ads_percentage_today 0.000000
unique_domains 0
queries_forwarded 0
queries_cached 0
clients_ever_seen 0
unique_clients 0
status enabled
---EOM---
And:
$ curl http://localhost/admin/api.php?summary
{"domains_being_blocked":"118,745","dns_queries_today":"0","ads_blocked_today":"0","ads_percentage_today":"0.0","unique_domains":"0","queries_forwarded":"0","queries_cached":"0","clients_ever_seen":"0","unique_clients":"0","status":"enabled
The UI show Zero's for everything other than domains being blocked (as indicated above).
Any ideas?
Thanks
Your web and FTL versions are still on 3.3 and 3.0 respectively. Try going through the commands you posted again.
I'm happy to report that repeating those commands appears to have fixed it!
Thanks @Mcat12.
I can stop reading through this file now... Hahaha.
Cheers buddy
That file isn't used anymore by the way, because the stats functionality got moved to FTL.


