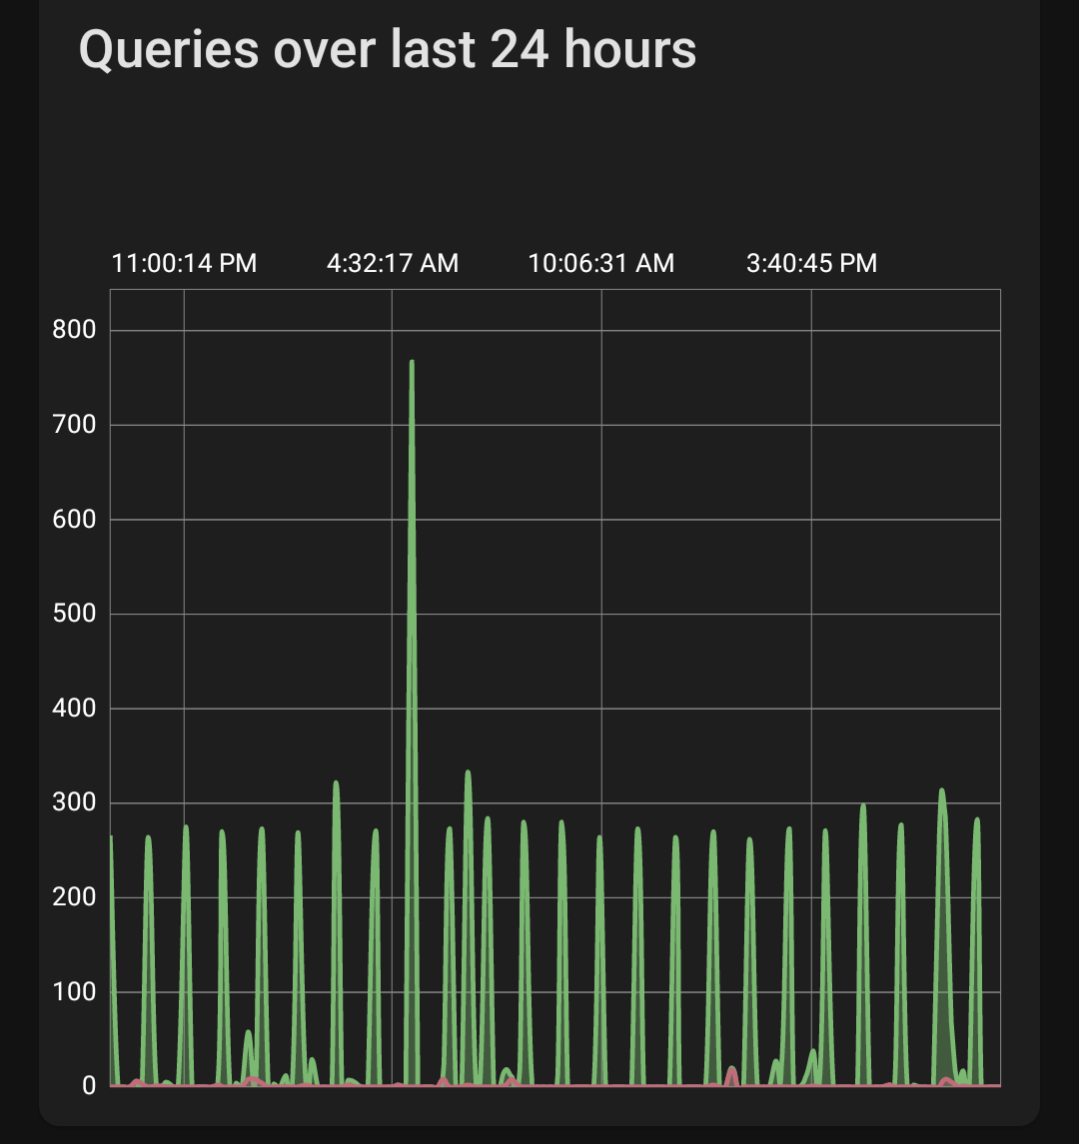
My query graph on the app never used to look like this but lately it's the norm. Any idea what might cause this kind of pattern??
Your network clients activity. ![]()
Inspect your Pi-hole's Query Log to find out whether that would be caused by a specific client requesting resolution for a specific domain.
If so, try to address the issue on the client, e.g. by disabling or reconfiguring whatever software is issuing those DNS requests.