tobbi
April 16, 2024, 12:18am
1
I just noticed that the "Queries in the last 24 hours" bar chart is empty. I generated a debug log for you to take a look at.
Here's my debug log:https://tricorder.pi-hole.net/heqBF4C4/
Your debug log shows that your router is distributing its own IP address as local DNS server:
*** [ DIAGNOSING ]: Discovering active DHCP servers (takes 10 seconds)
   Scanning all your interfaces for DHCP servers

   * Received 548 bytes from eth0:192.168.178.1
     Offered IP address: 192.168.178.23
     DHCP options:
      Message type: DHCPOFFER (2)
      router: 192.168.178.1
      dns-server: 192.168.178.1
How did you configure your router to take advantage of Pi-hole?
tobbi
April 16, 2024, 9:37am
3
I used this Pi-hole as upstream DNS server for your Fritz!Box .
Also, this used to work until very recently when my raspberrypi had to be restarted.
Did you perhaps allow usage of fallback DNS servers in your FritzBox configuration, allowing your FB to use public DNS servers instead of Pi-hole?
tobbi
April 16, 2024, 10:11am
5
My Pi-hole is actively used and I can see the numbers in "Total queries" going up. It's just the bar chart that doesn't display anything.
tobbi
April 16, 2024, 10:44am
6
What is the API endpoint that's responsible for getting that data? Maybe I can check my query log.
tobbi
April 16, 2024, 3:26pm
7
I created an issue on the github as well:
opened 03:25PM - 16 Apr 24 UTC
### Versions
- Pi-hole: v5.18.2
- AdminLTE: v5.21
- FTL: v5.25.1
### … Platform
- OS and version: Debian 10
- Platform: Raspberry Pi
### Expected behavior
"Total queries over last 24 hours" is showing live data and updating
### Actual behavior / bug
"Total queries over last 24 hours" is empty and not updating
### Steps to reproduce
Steps to reproduce the behavior:
1. Go to the pihole admin interface and log in.
2. Select "Dashboard" from the top left.
4. See the total queries bar chart and how it's not updating.
## Debug Token
- URL: https://tricorder.pi-hole.net/heqBF4C4/
<!--
Token generated by running `pihole -d`. https://docs.pi-hole.net/core/pihole-command/#debugger
The token is displayed at the end of the debug process if you allow for uploading the log file.
[✓] Your debug token is: https://tricorder.pi-hole.net/wim5hft4rq
Debug logs are visible ONLY to developers and support staff. They are not publically accessible and all logs are automatically deleted after 48 hours.
-->
### Screenshots

### Additional context
I posted about this problem here https://discourse.pi-hole.net/t/potential-bug-total-queries-over-last-24-hours-empty/69602 already. I just want to make sure to cross-reference this.
What API is responsible for updating the live data? I can check what the API returns for me then.
jfb
April 16, 2024, 4:47pm
8
There are a variety of calls that will show contents of the query database:
echo ">stats >quit" | nc localhost 4711

echo ">top-clients >quit" | nc localhost 4711

echo ">top-domains >quit" | nc localhost 4711

echo ">top-ads >quit" | nc localhost 4711

echo ">querytypes >quit" | nc localhost 4711

echo ">dbstats >quit" | nc localhost 4711

echo ">overTime >quit" | nc localhost 4711
I answered your question in Github earlier. There are more than one API endpoint:
Total queries 24h graph: admin/api.php?overTimeData10mins;
Clients over 24h graph: api.php?overTimeDataClients&getClientNames;
Query Types graph (this is working in your github screenshot) : api.php?getQueryTypes;
Upstream servers graph (also working) : api.php?getForwardDestinations.
That screenshot posted in Github shows the first graphic is empty and the second one is absent.
Do you see any error messages in your browser Console (devtools) ?
tobbi
April 16, 2024, 10:05pm
10
Sorry for cross-posting across support channels. If you'd like to suggest one platform where we can continue, I'll go ahead.
I do not see any errors in the browser console. Furthermore, I tried the same thing in Chromium where it also doesn't display the data. A few things happened in the last few days: One was that my raspberry pi shut down unexpectedly and I had to restart, the other one is a few ISP issues (15 minutes without internet access) that shouldn't have had any effect on this.
tobbi
April 16, 2024, 10:10pm
11
Here are the results for those queries:
jfb:
echo ">stats >quit" | nc localhost 4711
domains_being_blocked 1569084
echo ">top-clients >quit" | nc localhost 4711
0 23430 192.168.178.1 fritz.box
echo ">top-domains >quit" | nc localhost 4711
0 1307 spclient.wg.spotify.com
echo ">top-ads >quit" | nc localhost 4711
0 258 incoming.telemetry.mozilla.org
echo ">querytypes >quit" | nc localhost 4711
A (IPv4): 50.24
SVCB: 0.00
echo ">dbstats >quit" | nc localhost 4711
queries in database: 4072389
echo ">overTime >quit" | nc localhost 4711
1712962500 0 0
That may indicate a time issue.
tobbi
April 16, 2024, 10:47pm
13
pi@raspberrypi:~ $ date
user@My-MacBook-Pro % date
Seems okay
The results above for >overTime are showing timestamps from 3 or 4 days ago:
1712962500 => GMT : Friday, 12 April 2024 22:55:001713048900 => GMT : Saturday, 13 April 2024 22:55:00
tobbi
April 16, 2024, 11:08pm
15
Any idea what might cause that? Is a certain process not running?
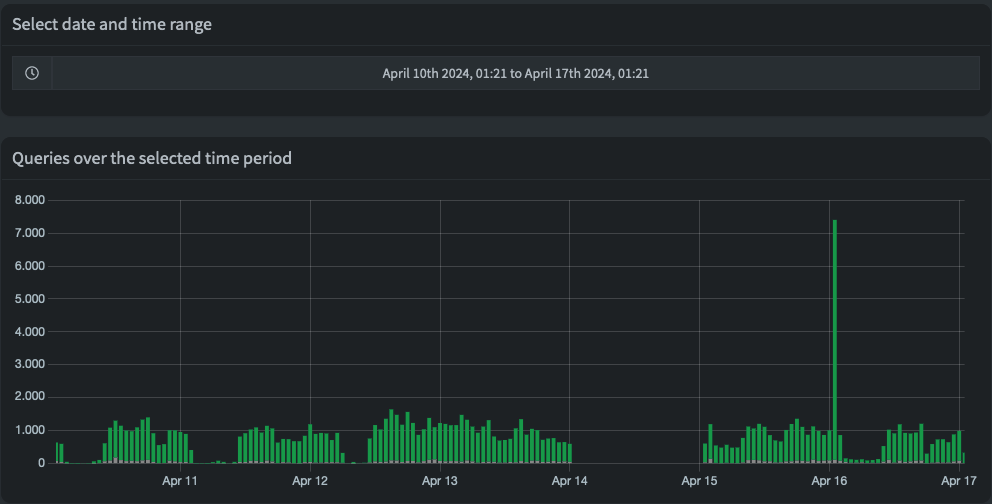
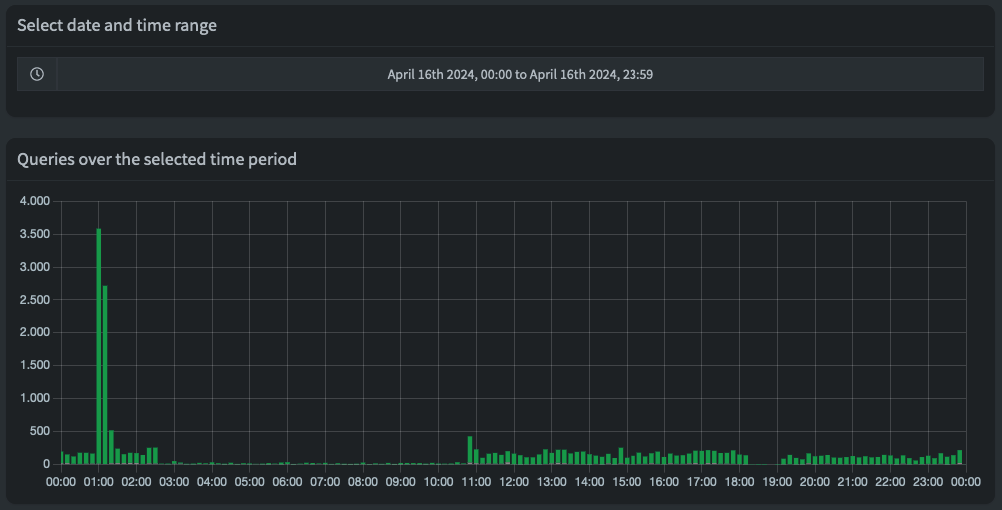
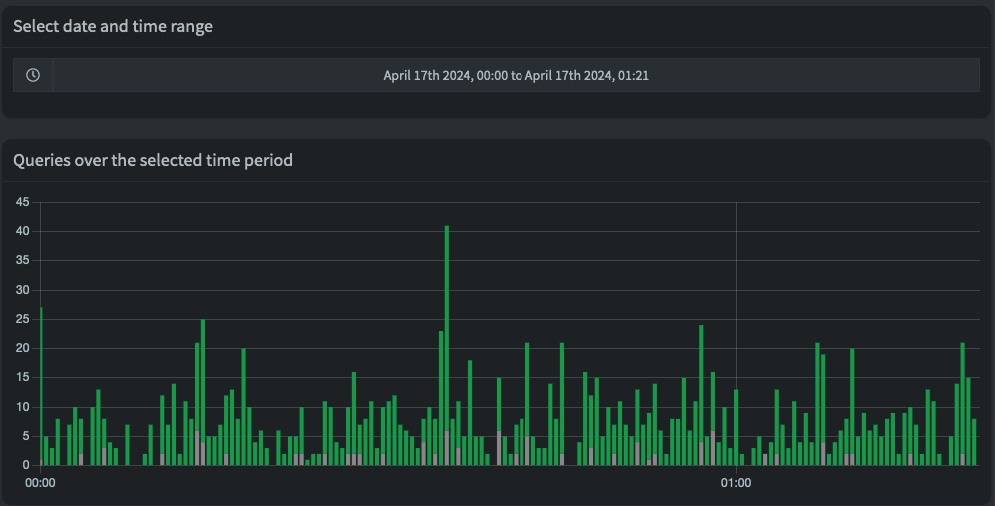
Do you see any data on the Long-term Data > Graphics
tobbi
April 16, 2024, 11:24pm
18
I see data for all the ranges:
tobbi
April 18, 2024, 9:15am
19
I'm gonna continue this issue only in here. Here's something I posted on the github issue:
Okay, so I noticed that admin/api.php?overTimeData10mins (apparently only executed once when loading) returns
{"domains_over_time":[],"ads_over_time":[]}
Not sure if that is correct.
api.php?overTimeDataClients&getClientNames returns
{"clients":[{"name":"fritz.box","ip":"192.168.178.1"},{"name":"localhost","ip":"127.0.0.1"},{"name":"raspberrypi.fritz.box","ip":"192.168.178.23"},{"name":"localhost","ip":"::1"},{"name":"raspberrypi.fritz.box","ip":"<my public v6 IP>"}],"over_time":[]}
tobbi
April 18, 2024, 9:16am
20
Is there anything else you need?
tobbi
April 22, 2024, 2:51pm
21
Anything further I can provide to help you debug this?