Domains included in imported blocklists are blocked.
Actual Behaviour:
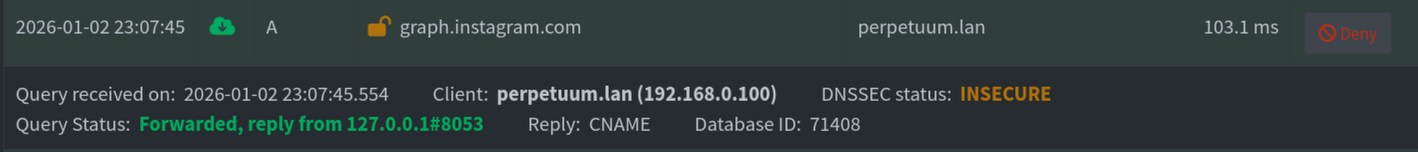
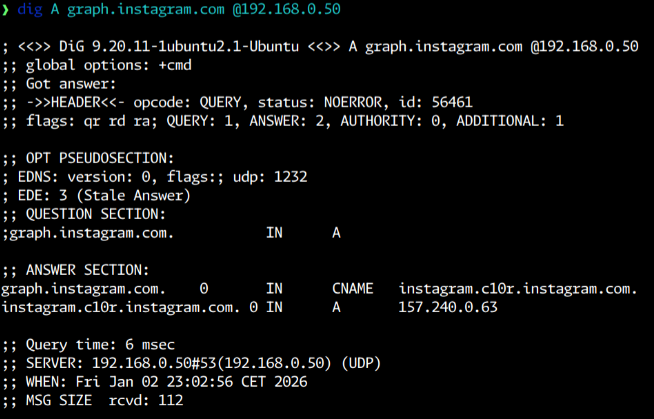
I am using two large lists for blocking (around 316k domains being blocked), but in the query log all domains are permitted, even the ones, that are in the list.
I am not able to pinpoint the exact moment when pihole stopped blocking, but when I set it up initially, the blocking was working correctly. But I have then disabled logging, and have enabled it only now for debugging, so I do not know for how long it has been broken.
Pi-hole is configured to use a local instance of stubby as a DNS server (which then forwards the requests to an anonymous DNS service via DoH) - I think that that is probably not relevant, but including this info as well in case it helps.
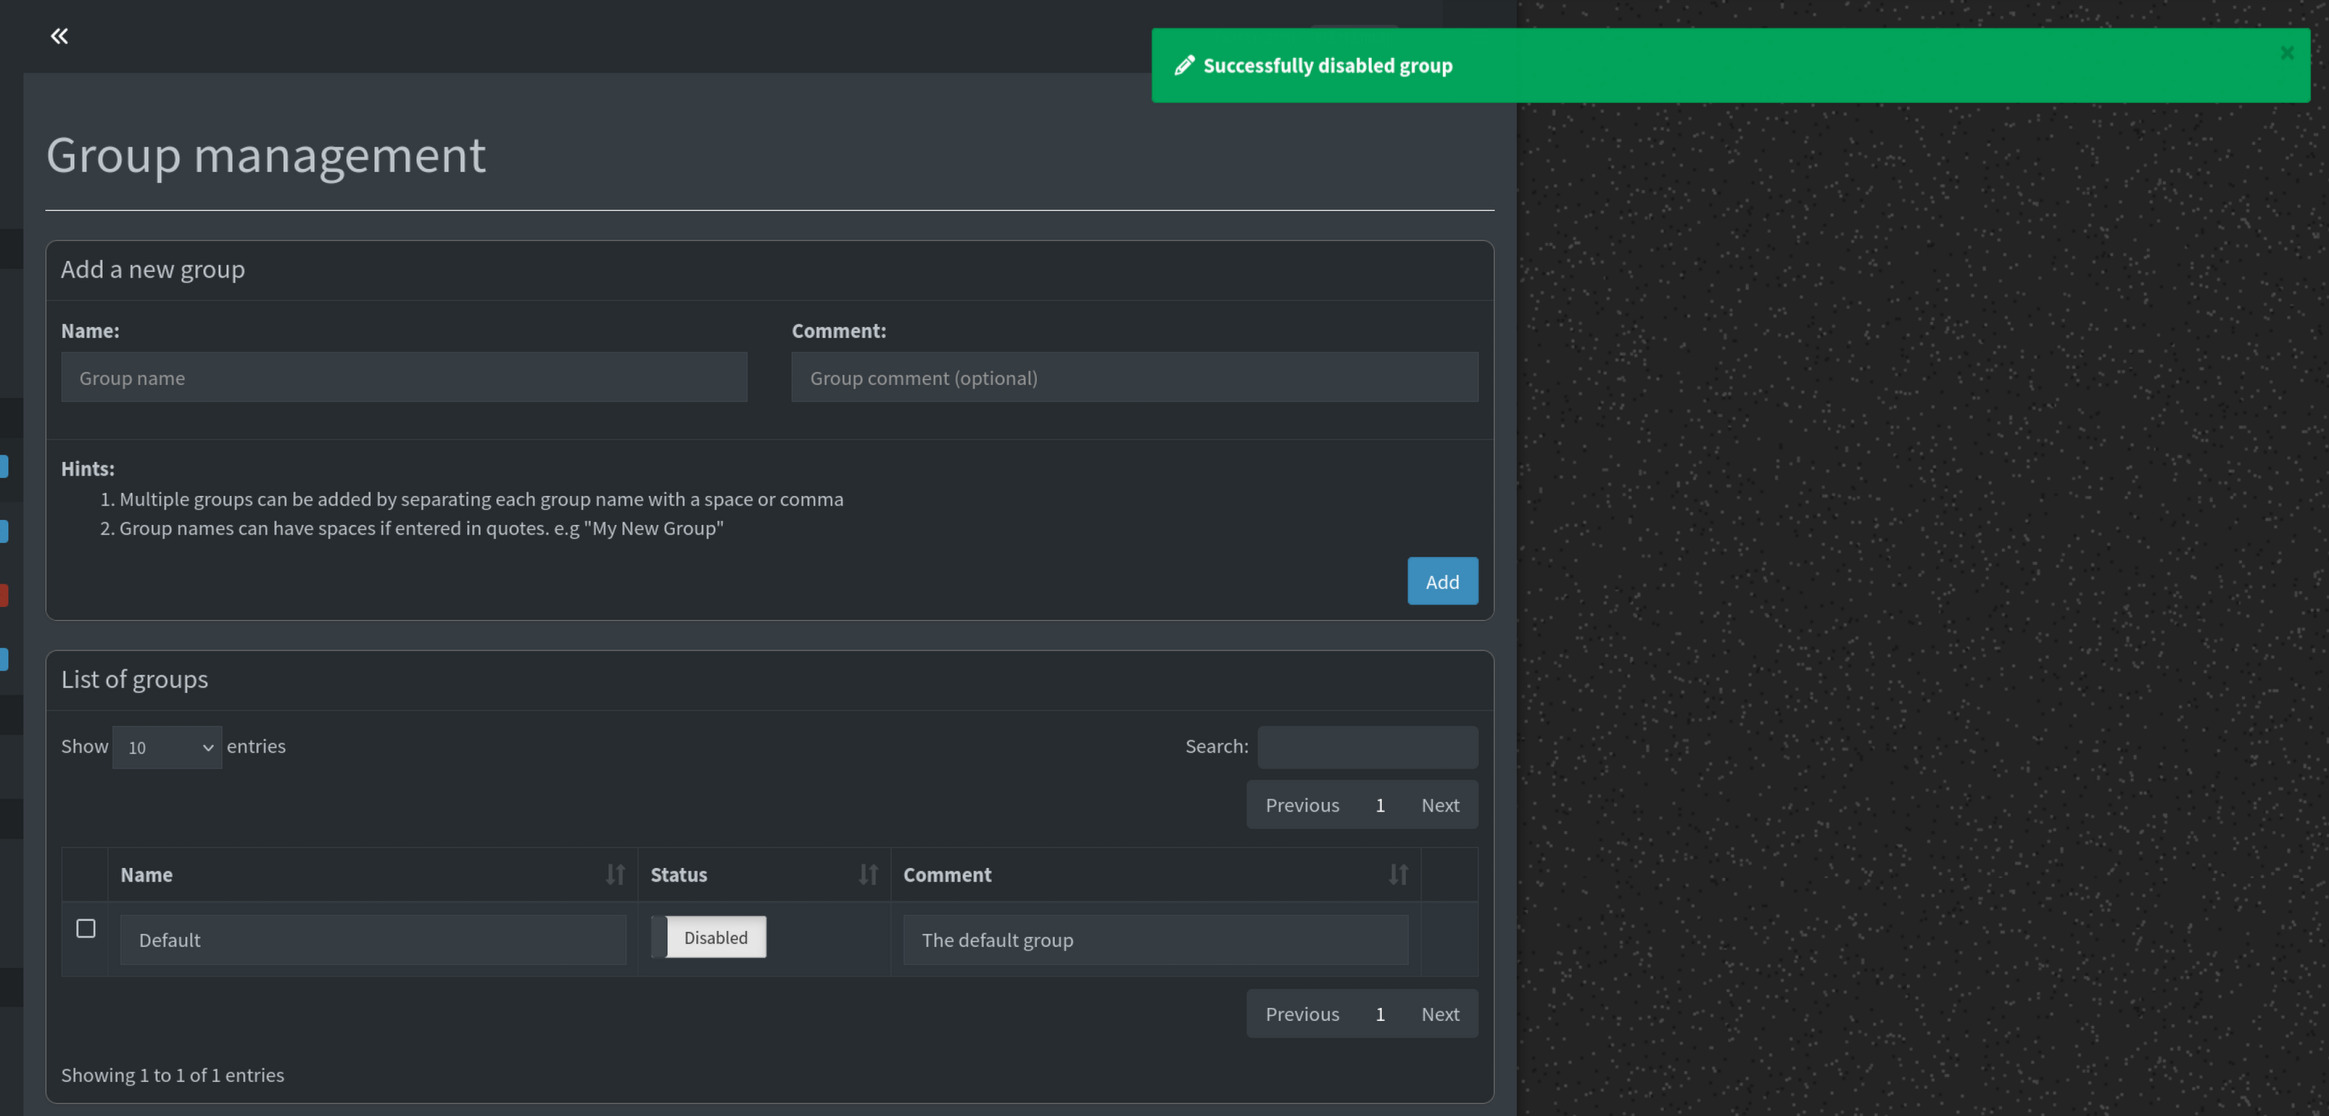
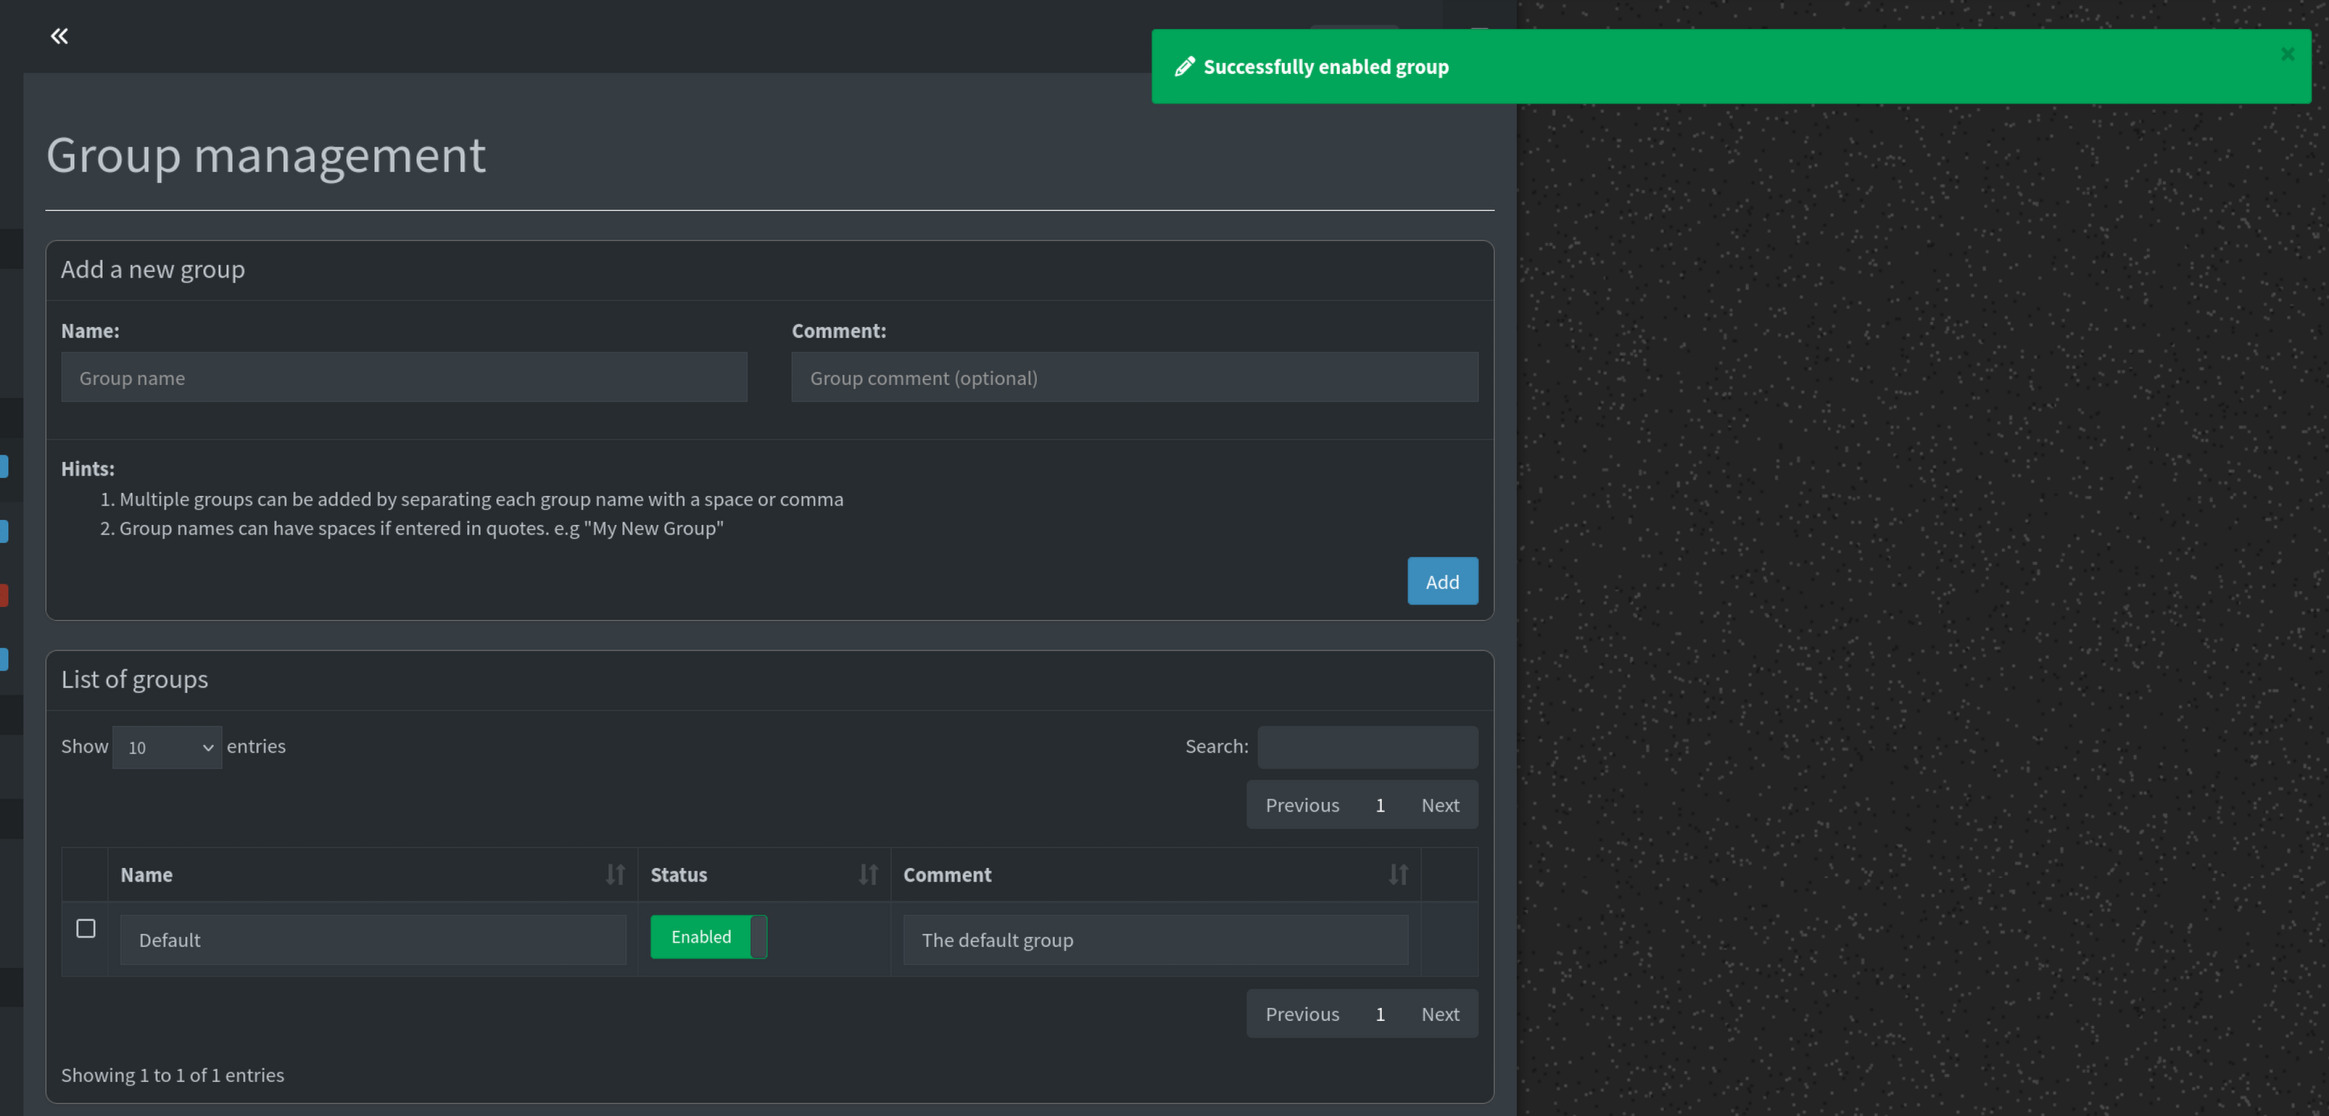
Your debug log shows the Default group to have been disabled:
*** [ DIAGNOSING ]: Groups
 id   enabled  name       date_added           date_modified        description
 ---- -------  ---------  -------------------  -------------------  -----------------
 0    no       Default    2025-12-28 16:04:04  2025-12-30 14:47:09  The default group
You have to re-enable the Default group, e.g. via Pi-hole's Groups UI.
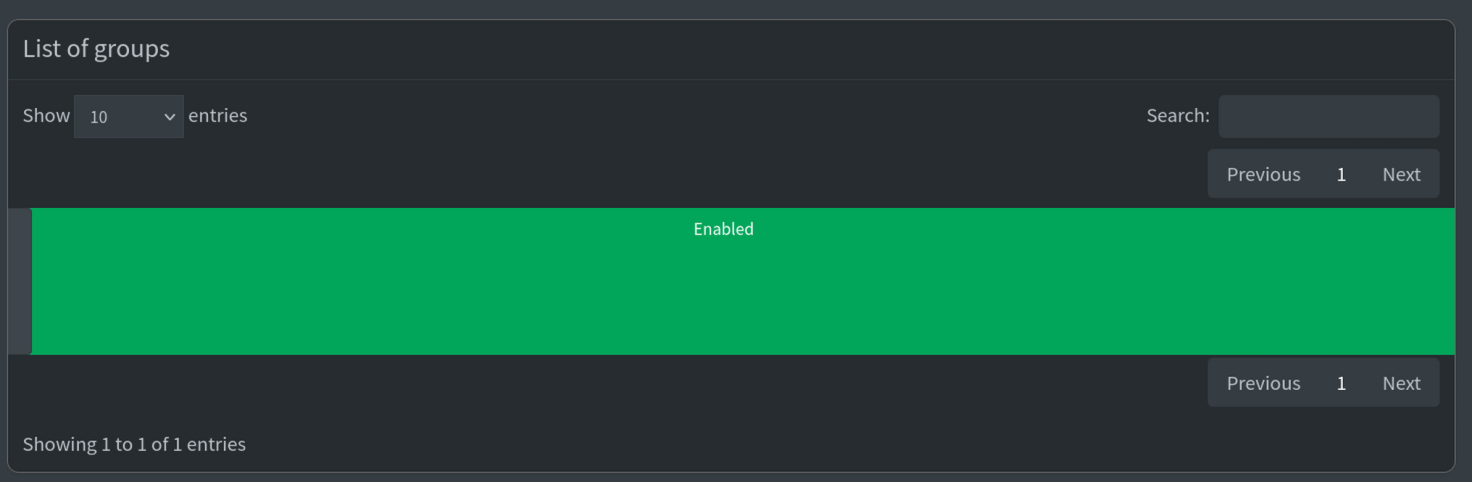
Actually, this "large green button" shows the page was incorrectly rendered. Not sure what is causing it... maybe a temporary browser glitch (try clearing the cache) or maybe some browser extension incompatibility.
If you see this again, try to reload the page.
If the issue persists, please open a new topic and we will investigate.