PiHole is running slow and even not able to resolve domains

Hello :waving_hand:,

I have been running PiHole on a RaspberryPi 4 for couple of months, but recently it started to become slow or even unable to resolve domains. Even the output of pihole -d is not consistent - sometimes it take a few seconds just to display the initial debugging information, sometimes it says that it cannot resolve the well know ad domain using 8.8.8.8. In the dashboard I can see that there are N/A replies from time to time - sometimes more, sometimes less.

Usually a restart helps to speed things up, but then it becomes slows again.

I was running unbound as well, and it was running ok, but I stopped it after those problems started happening. Now I have it using 1.1.1.1.
Some of the additional software that I use is qBittorrent and Plex. I was wondering if the torrent client is doing something, but then I have been running it from the start as well.

Sometimes if I see that I do not get replies, I try to manually dig 8.8.8.8 or 1.1.1.1, and sometimes they timeout. If I do this on my Mac, they work. It is really random and I cannot figure it out :pensive_face:

Is there some kind of a checklist that I can go through to see if there are some problems?

Maybe I just need to reinstall the whole Pi

Debug Token:

https://tricorder.pi-hole.net/czv0zr9igc

I can see that the gateway ping is giving an error, but if I do ping 10.0.0.1 it does work. Not sure why it is not working for pihole
Check logs:

tail -f /var/log/{pihole.log,pihole-FTL.log,messages,syslog}

Check kernel ring buffer:

dmesg -w

Specifically for voltage underun messages:

dmesg | grep -i voltage

Check sufficient disk space:

df -h

Check sufficient ram:

free -h

Check load:

uptime

top

Check correct date/time:

timedatectl

Do you have multiple default routes ?

ip r | grep default

Looks like I have some I/O errors for my external drive (will have to look into them, but just that

There are no messages

There is enough storage, just 30% used

There is more than enough RAM. I have the 4GB version and I am actually monitoring it with Netdata

The load is completely ok as well (under 10% when the torrent client is running, and even lower if it is not)

Time is ok

Looks like I have both LAN and WAN, so I disabled the WiFi on the board, and now the warning from the debug message disappeared. Could it be that this was causing the problem? Sounds probable

I will monitor it now to see how this will affect the operation of PiHole


Thank you so much for the help @deHakkelaar :man_bowing:

1 Like

I believe the old debugger cant cope with two or more default routes.
Nothing to worry bout as long as you can ping.

What command are you using and what is the result?

User deHakkelaar is showing you many of them. You may have a hardware problem; these can be tough to diagnose. A Pi-4 is pretty power hungry, so you'll want the power supply specified by RaspberryPi. Also, check simple things like your ethernet cable (swap it out, etc.).

Your debug log shows very little activity for the previous 24 hours.

   [2020-04-16 00:22:01.339 16074] Imported 4 queries from the long-term database
   [2020-04-16 00:22:01.339 16074]  -> Total DNS queries: 4
   [2020-04-16 00:22:01.339 16074]  -> Cached DNS queries: 2
   [2020-04-16 00:22:01.339 16074]  -> Forwarded DNS queries: 2
   [2020-04-16 00:22:01.339 16074]  -> Exactly blocked DNS queries: 0
   [2020-04-16 00:22:01.339 16074]  -> Unknown DNS queries: 0
   [2020-04-16 00:22:01.339 16074]  -> Unique domains: 4
   [2020-04-16 00:22:01.339 16074]  -> Unique clients: 3
   [2020-04-16 00:22:01.339 16074]  -> Known forward destinations: 1

I use dig github.com @1.1.1.1 for example. I do not remember the exact reply, but I think it was something related to timing out. The result was super short, like 3-4 lines.

I keep trying things, and I restart it from time to time. Here is a new output from the debug command -> https://tricorder.pi-hole.net/5hiupzfbf2

I am using the official Raspberry Power brick, so I guess it should be working as expected.

The thing is that it was working super smooth even with unbound. It started behaving like that for the last week or so. I will keep monitoring it and if it is not getting better, I will probably just reinstall the OS.

Other than some lighttpd warnings (perhaps related to your other software), this debug log is normal.

-rw-r--r-- 1 www-data www-data 2349 Apr 16 15:52 /var/log/lighttpd/error.log
   2020-04-12 00:00:29: (server.c.1759) logfiles cycled UID = 0 PID = 15772 
   2020-04-14 22:54:15: (server.c.2059) server stopped by UID = 0 PID = 1 
   2020-04-14 22:55:00: (server.c.1464) server started (lighttpd/1.4.53) 
   2020-04-14 22:55:00: (server.c.1493) WARNING: unknown config-key: alias.url (ignored) 
   2020-04-14 22:55:00: (server.c.1493) WARNING: unknown config-key: proxy-core.protocol (ignored) 
   2020-04-14 22:55:00: (server.c.1493) WARNING: unknown config-key: proxy-core.backends (ignored) 
   2020-04-14 22:55:00: (server.c.1493) WARNING: unknown config-key: proxy-core.rewrite-request (ignored)

I cleared them as well :slight_smile:

Is there a way to query the query log to see only the N/A results or results that took more time than "n"?

If you use dig like above, your querying Cloudflares DNS server 1.1.1.1.
This will only test 53 UDP/TCP outgoing via the default route to the internet from the host running dig.
It wont test Pi-hole's own DNS service.
And if timing out, indicates most likely something else wrong thats not Pi-hole related.

Below to test Pi-hole's DNS querying IP 127.0.0.1 on the loopback interface:

dig github.com @127.0.0.1

Below querying Pi-hole's own IP (hostname -I) on the physical interface:

dig github.com @$(hostname -I)

My bet is on those "I/O errors for my external drive".

You cant really query the logs.
But all DNS queries are stored in the database with below scheme:

pi@noads:~ $ sqlite3 /etc/pihole/pihole-FTL.db ".schema queries"
CREATE TABLE queries ( id INTEGER PRIMARY KEY AUTOINCREMENT, timestamp INTEGER NOT NULL, type INTEGER NOT NULL, status INTEGER NOT NULL, domain TEXT NOT NULL, client TEXT NOT NULL, forward TEXT );
CREATE INDEX idx_queries_timestamps ON queries (timestamp);

So the columns stored are:

id, timestamp, type, status, domain, client, forward

Below I query for status=4:

pi@noads:~ $ sqlite3 /etc/pihole/pihole-FTL.db 'SELECT * FROM queries WHERE status=4'
3144162|1583936617|1|4|use-application-dns.net|127.0.0.1|
3167104|1584189412|1|4|use-application-dns.net|10.0.0.220|
3167331|1584191804|1|4|use-application-dns.net|10.0.0.220|

You'd have to figure out what the "N/A" status is as an integer as I dont have them :wink:

The daily history is kept in /var/log/pihole.log and that is easily searched.

grep reply /var/log/pihole.log*

This output can be piped to additional greps to narrow the output.

Yeah I ment more like query in the sense of asking a daemon for something.
Of course you can search/grep the logs but bit hard to grep for the query and the result.

The query log as displayed on the dashboard has a search window, and you can sort the various columns as well to focus on content of interest.

Yes, I usually try both PiHole and some other like 8.8.8.8 or 1.1.1.1. And sometimes, if dig github.com is failing, dig github.com @{some-external} is failing as well.

Thank you for the hint with the database, I will probably test it, even just out of curiosity, which now that I think about it might be part of the problem :joy:

I have tried the dashboard, but if I try to filter by "N/A" it is not returning anything, which I think that it might be related to the fact that they are stored as integers in the DB. I have not tried sorting. It would be nice to see which are the slowest replies or maybe even a graph showing the performance (I am a sucker for stats :expressionless:)


Just as an update, after everything that I did, it has been running quite ok so far. There are no super slow replies (there were some that took something like 10 seconds) and no N/A replies.

Thanks a lot for the help

I celebrated too early. The problem is back.

Runnig dig from one of the clients, is not able to resolve the domain, using the Google's DNS.

➜ dig cdn.sstatic.net @8.8.8.8

; <<>> DiG 9.10.6 <<>> cdn.sstatic.net @8.8.8.8
;; global options: +cmd
;; connection timed out; no servers could be reached

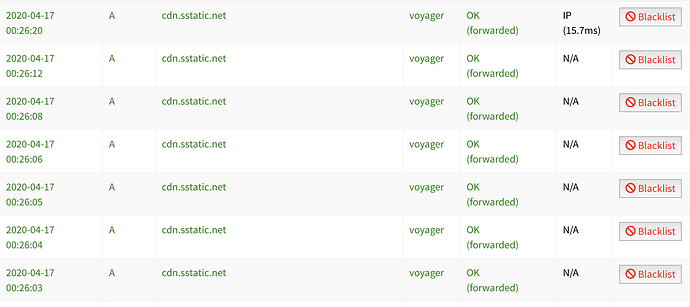
And I see that it has failed couple of times for PiHole

The debug output looks similar to before: https://tricorder.pi-hole.net/wxyfgaaho1

This indicates the problem lies outside of Pi-hole. This query goes directly to the Google DNS server at 8.8.8.8 with no involvement from Pi-hole.

Are you running any firewalls or IPTables that can be interfering with DNS traffic on port 53?

No, I am not running any firewalls. I am running couple of docker images, but neither one of them is using port 53.

I start to think that it might be related to the router. Whenever things start to slow, a router restart is one of the things that can help as well.

Or maybe it is qBittorrent. :slight_smile:


PS Reconfigured PiHole, restarted all and now I will see

This topic was automatically closed 21 days after the last reply. New replies are no longer allowed.