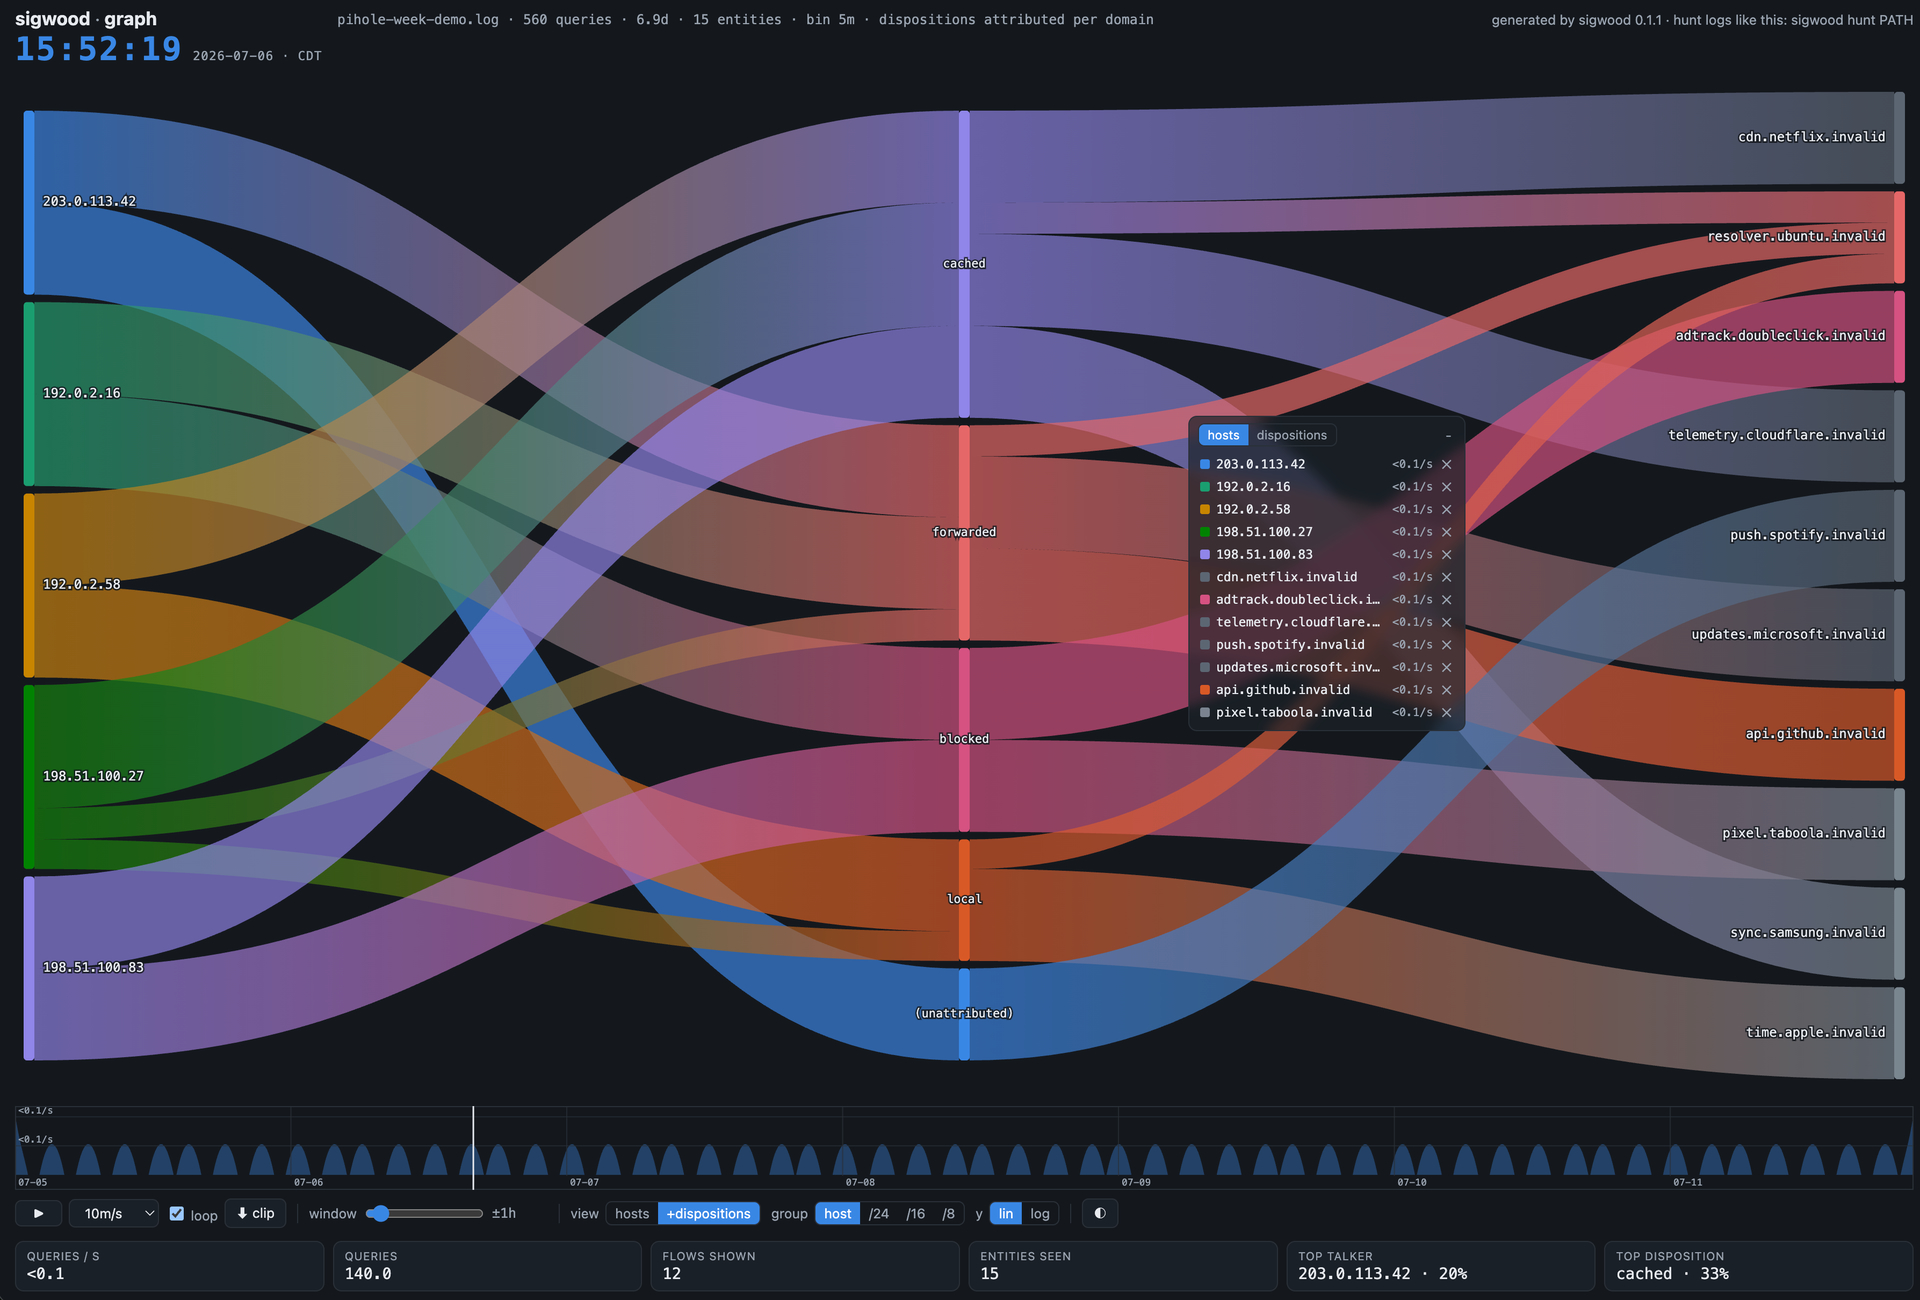
I have created a tool called sigwood that lets you visualize your Pi-hole activity in an animated Sankey diagram (and it does other cool stuff like anomaly detection with your Pi-hole query logs). Free and open source, you can find it on github. If you try it out I'd love to hear your impressions!
Here's a screenshot of it in action: