What this didn't help with though is the entries missing in the long term data log - or were those maybe shown incorrectly in the standard data log?
(Please see Screenshot 3 and 4)
I think it depends on when you look, AFAICT the long term log is a little behind the live query log, but I am unaware of the finer details as I don't really use that section very often.
Hopefully someone else will be able to provide you with a more solid answer for that part
My assumption is, that the timestamp should be the same within the long term data query log and the standard query log. At least this is what I believe to have observed until now.
I checked the long term data query log multiple times, so after more than an hour now again - but I still cant find the entries shown in the 3rd screenshot....
The Unknown (0) for SRV are bug reported already on Github. They are working on a fix.
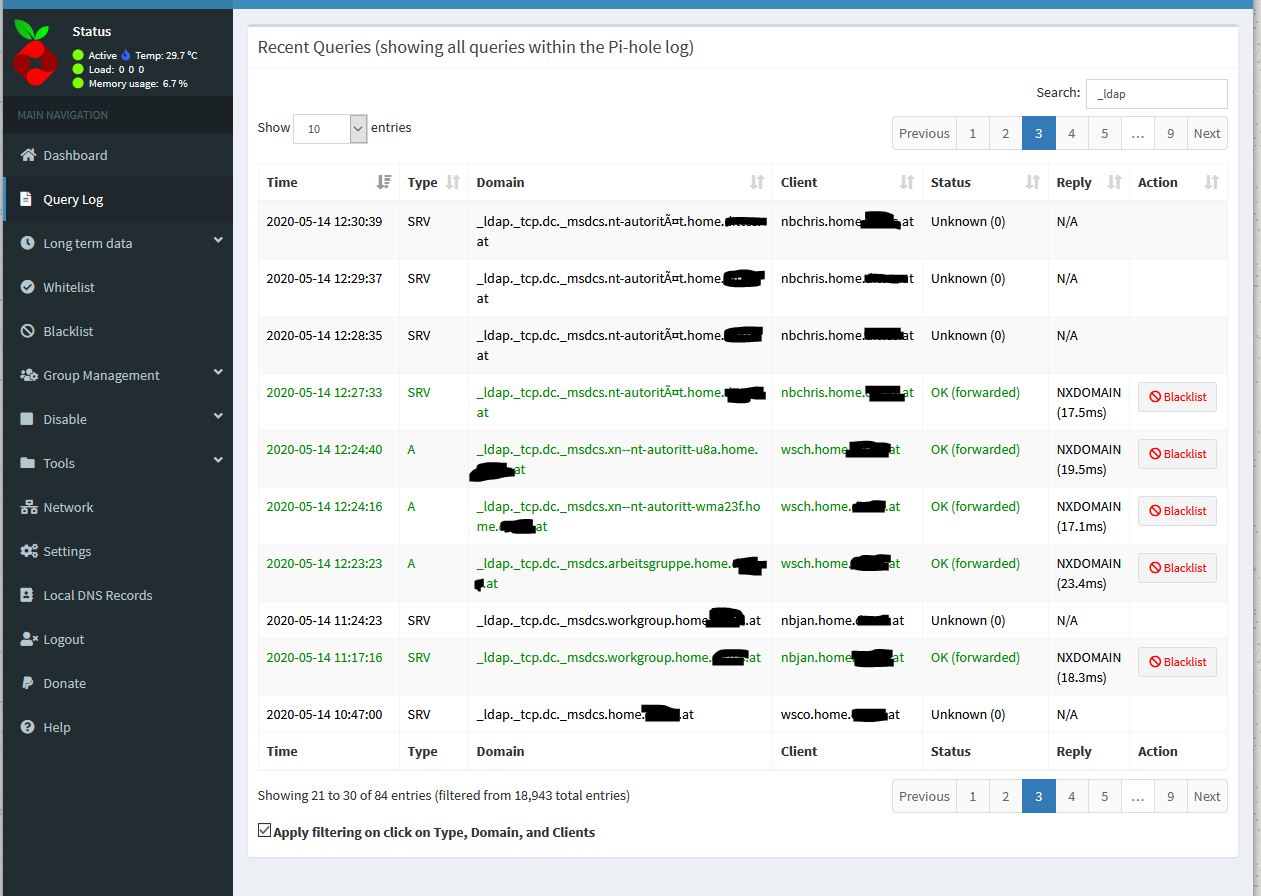
The upper screenshot doesn't show the 12:27:33 query. Try after clicking on the "show all" link in the header of the table to first get all queries and then filter on them.
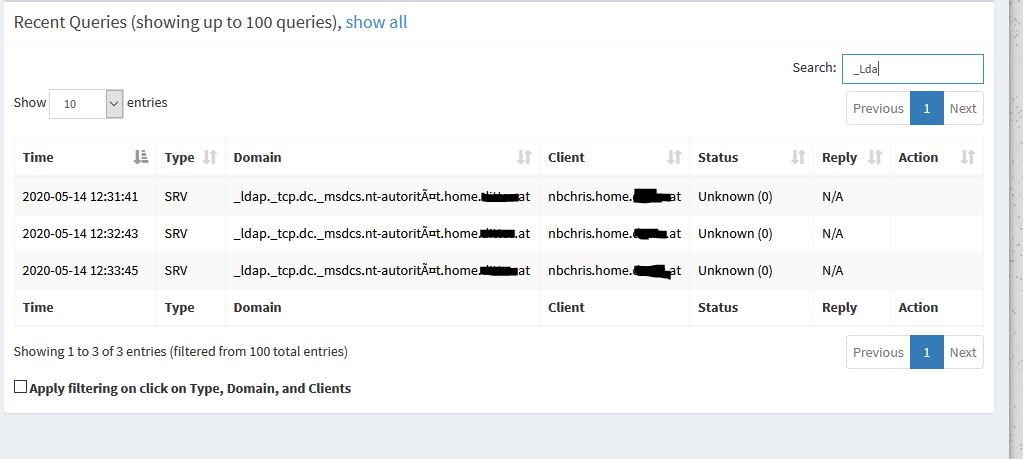
The screenshot above with the 3 black entries comes from the standard query log (which content is gone pretty quickly).
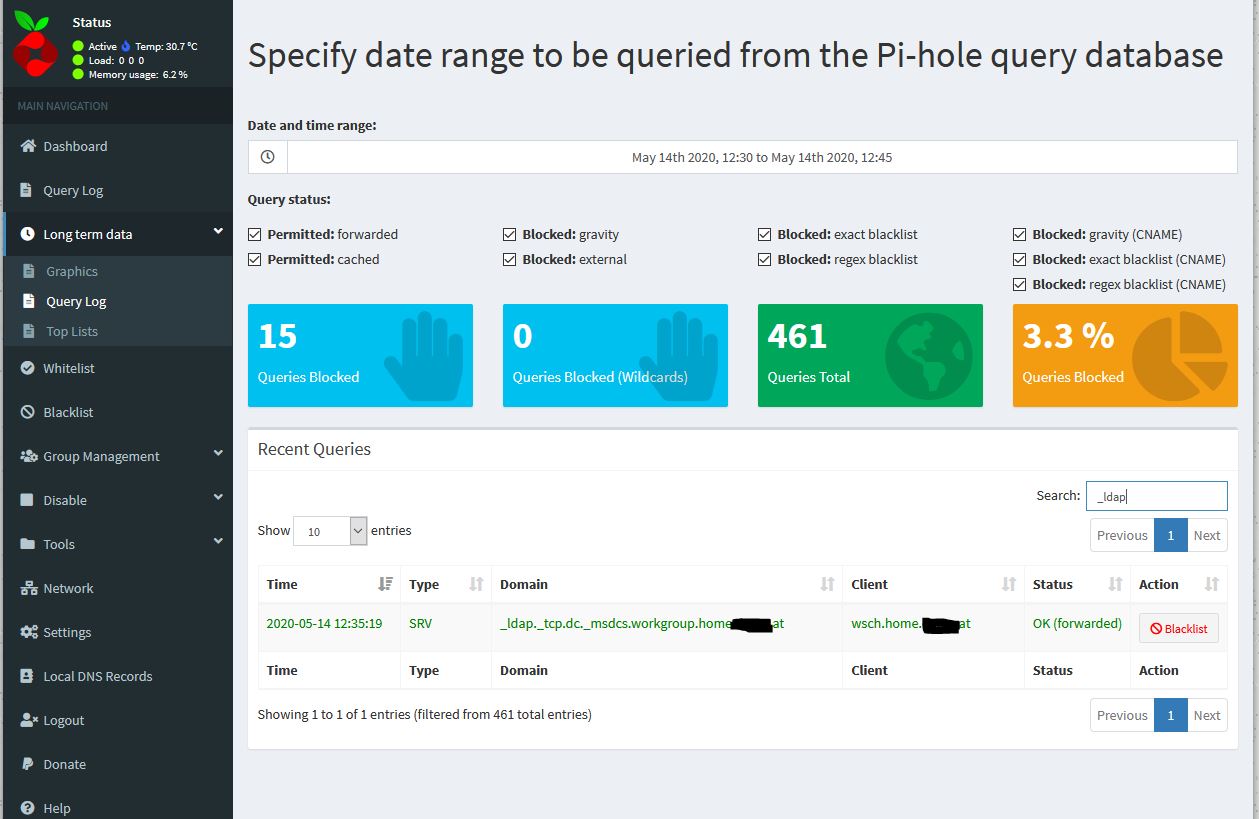
The screenshot with the green entry and the time stamp 2020-05-14 12:27:33 represents the long time data query log and I just wanted to show that the respective queried domain is showing up there as being answered properly.
However as you pointed out the entries showing status "Unknown" is something being worked on we do not have to further think about.
BUT
If I look for the 3 black entries from the standard query log (screenshot above, time between 2020-05-14 12:31 - 12:34) in the long term data query log I can't find those:
Not sure though how this relates to entries not ending up in the Long term data query log.. to me it doesn't look like only records showing status "Unknown" in the standard query log aren't there...
Did you intend to formulate this in a positive way ("to me it does look like...")?
Else than that: have a look at your screenshot. The answer to your question is that they do not show up because you didn't tick a box for the "Unknown" query status. This is where the bug is: This check box is missing.
If you look at my very first post in this thread you can see an entry that obviously does show up in both the query log (as unknown) and in the long term data query log (as blocked).
On the other hand I have to admit that this isnt an evidence that it's not only records with status "Unknown" that wont make it to the long term data query long....
But do I get you right that you are saying I can't see those entries with the status "Unknown" in the long term data query log as I can't filter for them (screenshot_long_term_data_query_log_3) from above?
That would really confuse me....
What is Status Unknown actually telling? - I understand OK with Blocked, Forwarded and Cached.. but unknown..
From what has been told above I understood that is something that shouldn't even happen and is being worked on...?
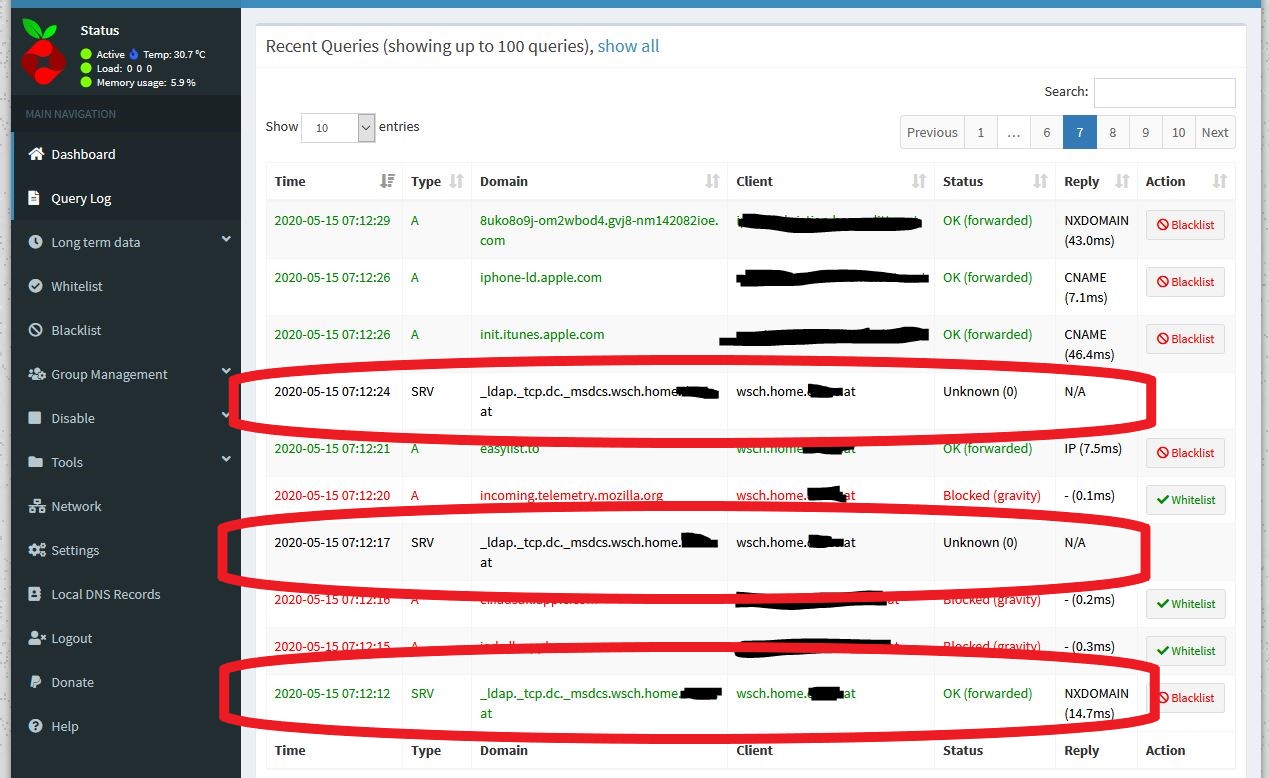
So that means the reason for why this happens is that since V5 SRV records are being cached and while the initial query is showing NXDOMAIN subsequent ones are showing "Unknown" - correct?
This is then also what I can see in the screenshot below - right?
The patch fixing this has been merged two days ago, so this will be fixed in Pi-hole v5.1. Note that, again, this is solely cosmetic (as in displaying) issue, the underlying machinery works without any issues.