Pi-hole queries / client activity graph not working correctly

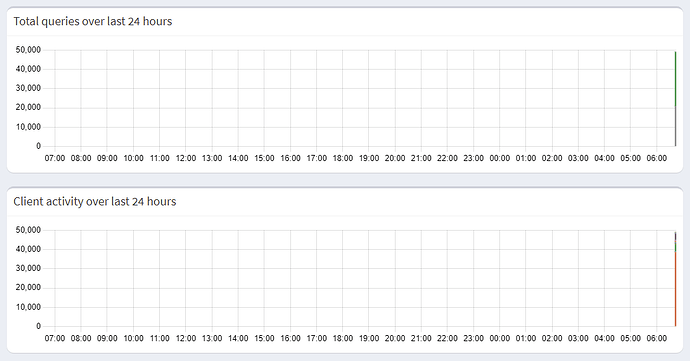
Morning all, running the latest versions (Pi-hole v5.14.1 / FTL v5.19.1 / Web interface v5.17) and my graphs are not displaying correctly. Ctrl + F5 in chrome has not made a difference and I am observing the same behavior in Firefox. Any suggestions for a novice?

Thank you!

Baggy

There has just been an update (FTL v5.19.2) to fix a problem where FTL would stop working. Can you update to the latest version, and then see how it goes from there.

pihole -up
1 Like

Thank you very much - fixed!

1 Like

Now it broken again, any other suggestions?

Please upload a debug log and post just the token URL that is generated after the log is uploaded by running the following command from the Pi-hole host terminal:

pihole -d

or do it through the Web interface:

Tools > Generate Debug Log

Also, run from your Pi-hole's host machine, what's the output of:

echo ">stats >quit" | nc localhost 4711
echo ">top-domains >quit" | nc localhost 4711
echo ">top-ads >quit" | nc localhost 4711
echo ">top-clients >quit" | nc localhost 4711

Sorry for the delay!

https://tricorder.pi-hole.net/Fv7f5LT8/

ubuntu@pihole001:~$ echo ">stats >quit" | nc localhost 4711
domains_being_blocked 158531
dns_queries_today 2544
ads_blocked_today 1004
ads_percentage_today 39.465408
unique_domains 4288
queries_forwarded 1143
queries_cached 390
clients_ever_seen 47
unique_clients 23
dns_queries_all_types 2544
reply_UNKNOWN 56
reply_NODATA 613
reply_NXDOMAIN 137
reply_CNAME 291
reply_IP 1364
reply_DOMAIN 20
reply_RRNAME 3
reply_SERVFAIL 0
reply_REFUSED 0
reply_NOTIMP 0
reply_OTHER 0
reply_DNSSEC 35
reply_NONE 0
reply_BLOB 25
dns_queries_all_replies 2544
privacy_level 0
status enabled
ubuntu@pihole001:~$ echo ">top-domains >quit" | nc localhost 4711
0 113 discourse.pi-hole.net
1 102 
2 80 dl.acronis.com
3 29 _dns.resolver.arpa
4 26 dns.opendns.com
5 23 presence.gog.com
6 23 rog-live-service.asus.com
7 19 gateway.fe.apple-dns.net
8 
9
ubuntu@pihole001:~$ echo ">top-ads >quit" | nc localhost 4711
0 963 telemetry.acronis.com
1 26 api.segment.io
2 6 mask.icloud.com
3 4 incoming.telemetry.mozilla.org
4 3 revnok-com.preview-domain.com
5 3 
6 2 beacon.krxd.net
7 2 mask-h2.icloud.com
8 1 ssc.33across.com
ubuntu@pihole001:~$ echo ">top-clients >quit" | nc localhost 4711
0 2116 192.168.1.136 
1 230 :: pi.hole
2 89 192.168.1.185 
3 24 127.0.0.1 
4 20 192.168.1.175 
5 11 192.168.1.155 
6 8 192.168.1.183 
7 8 192.168.1.141 
8 8 192.168.1.170 
9 6 192.168.1.186 
ubuntu@pihole001:~$

Your initial graph seems to show a sudden spike of about 50,000 DNS requests, potentially dwarfing smaller numbers to not be visible in that graph.

Those API results would have been most useful if run directly after such a spike, as they may not reflect the situation at the time of your post anymore.

A sudden spike may be caused by DNS loops, and you may indeed have closed such a loop in two places if your router would use Pi-hole as its upstream DNS server (in addition to distributing it as local DNS server via DHCP, which your DHCP server does).

*** [ DIAGNOSING ]: contents of /etc/dnsmasq.d

-rw-r--r-- 1 root root 1.6K Nov 18 08:33 /etc/dnsmasq.d/01-pihole.conf
   server=208.67.222.222
   server=208.67.220.220
   server=192.168.1.1
   rev-server=192.168.1.0/24,192.168.1.1

For once, you are using your router as one of Pi-hole's upstreams, which would fully close a loop if it's used. This may well trigger a sudden surge on a restart, when Pi-hole is probing all its upstreams for the fastest responding one.

You should remove 192.168.1.1 from your Pi-hole's upstreams via Settings | DNS.

You have also enabled Pi-hole's Conditional Forwarding, which may close a partial DNS loop for local names neither known by Pi-hole nor your router.
This may happen if a client would be in the habit of sending such a request, which makes it a lot less likely to occur than a full loop.

Bur your debug log shows also some peculiar networking I probably need help to understand - your Pi-hole host carries two IPv4 addresses for the same eth0 interface:

*** [ DIAGNOSING ]: Networking
[✓] IPv4 address(es) bound to the eth0 interface:
    192.168.1.196/24
    192.168.1.2/24

Your DHCP server is distributing both of those, but also two public OpenDNS ones, for a total of 4 different DNS servers:

*** [ DIAGNOSING ]: Discovering active DHCP servers (takes 10 seconds)
   Scanning all your interfaces for DHCP servers
   
   * Received 315 bytes from eth0:192.168.1.1
     Offered IP address: 192.168.1.196
     DHCP options:
      Message type: DHCPOFFER (2)
      dns-server: 192.168.1.2
      dns-server: 208.67.222.222
      dns-server: 192.168.1.196
      dns-server: 208.67.220.220
      router: 192.168.1.1
      --- end of options ---

Stating two private range IP addresses for the very same interface of the same machine in the same subnet seems somehow redundant?
And stating those public resolvers would allow your clients to by-pass your Pi-hole via OpenDNS.

I also notice that your Pi-hole host system seems to be using only those OpenDNS resolvers:

*** [ DIAGNOSING ]: contents of /etc

lrwxrwxrwx 1 root root 39 Aug  1  2020 /etc/resolv.conf -> ../run/systemd/resolve/stub-resolv.conf
   nameserver 208.67.222.222
   nameserver 208.67.220.220

That's a sensible configuration, as it would allow your host system to run updates and repairs, even if Pi-hole's DNS service would be inoperational at times.

This is accompanied by some interesting routing - your routing table has a remarkable count of single target entries:

*** [ DIAGNOSING ]: Network routing table
   default via 192.168.1.1 dev eth0 proto dhcp src 192.168.1.196 metric 100 
   default via 192.168.1.1 dev eth0 src 192.168.1.2 metric 202 
   192.168.1.0/24 dev eth0 proto dhcp scope link src 192.168.1.2 metric 202 
   192.168.1.1 dev eth0 proto dhcp scope link src 192.168.1.196 metric 100 
   192.168.1.2 dev eth0 proto dhcp scope link src 192.168.1.196 metric 100 
   192.168.1.196 dev eth0 proto dhcp scope host src 192.168.1.196 metric 100 
   208.67.220.220 via 192.168.1.1 dev eth0 proto dhcp src 192.168.1.196 metric 100 
   208.67.222.222 via 192.168.1.1 dev eth0 proto dhcp src 192.168.1.196 metric 100

I'm specifically wondering about the last two, routing the same public OpenDNS resolvers through 192.168.1.1. But they would have been routed through the default gateway anyway?

Are you perhaps redirecting DNS traffic to your Pi-hole somewhere in your network (e.g. via a dedicated firewall or your router)?
Good morning Bucking_Horn - thank you for such a comprehensive reply.

I have removed 192.168.1.1 from my Pi-hole upstream settings and disabled Conditional Forwarding - I thought I needed this for local name resolution.

I have also removed the second IP Address (192.168.1.196), I am not really sure why I set this up in the first place.

I ave removed the following addresses from DHCP:

dns-server: 208.67.222.222
dns-server: 192.168.1.196
dns-server: 208.67.220.220

I think removing 192.168.1.196 has fixing my routing table, here is the new debug token:

https://tricorder.pi-hole.net/OXqm8EXl/

I notice 192.168.1.196 is still being offered by DHCP - I will double check my router/ DHCP Server.

After the changes, I rebooted my Pi-Hole and the graph displays correctly, after 5-10 minutes, it's doing the same thing, right now, I only have 200 queries.

Thanks once again for your incredible help!

Just in case it's relevant, most recent debug token is:

https://tricorder.pi-hole.net/HniRV1Sd/

Does your host perhaps try to resolve an NTP server domain?

Also, those API commands I've asked you to run may come in handy now.
Please provide their output again.

Pi-hole is reporting database entries in the future:

*** [ DIAGNOSING ]: contents of /var/log/pihole

-rw-r--r-- 1 pihole pihole 57K Nov 19 09:38 /var/log/pihole/FTL.log
   -----tail of FTL.log------
 [2022-11-19 09:34:17.560 1839M] 
            WARN: Found database entries in the future (2022-11-19 09:35:00 (1668803700),
            last timestamp for importing: 2022-09-10 06:55:00 (1662749700)).
            Your over-time statistics may be incorrect (found in src/dnsmasq_interface.c:691)

Please verify your Pi-hole host's time and timezone settings.

I am in New Zealand, time and date is accurate...

API Commands:

ubuntu@pihole001:~$ echo ">stats >quit" | nc localhost 4711
domains_being_blocked 158531
dns_queries_today 65749
ads_blocked_today 23555
ads_percentage_today 35.825642
unique_domains 2213
queries_forwarded 31145
queries_cached 10830
clients_ever_seen 37
unique_clients 37
dns_queries_all_types 65749
reply_UNKNOWN 724
reply_NODATA 16977
reply_NXDOMAIN 4994
reply_CNAME 8663
reply_IP 32187
reply_DOMAIN 680
reply_RRNAME 32
reply_SERVFAIL 0
reply_REFUSED 0
reply_NOTIMP 0
reply_OTHER 0
reply_DNSSEC 663
reply_NONE 0
reply_BLOB 829
dns_queries_all_replies 65749
privacy_level 0
status enabled

ubuntu@pihole001:~$ echo ">top-domains >quit" | nc localhost 4711
0 3321 discourse.pi-hole.net
1 2734
2 2065 dl.acronis.com
3 922 _dns.resolver.arpa
4 724 forum.golangbridge.org
5 657 gateway.fe.apple-dns.net
6 573 presence.gog.com
7 528 dns.opendns.com
8 522 doh.opendns.com
9 513 dns.umbrella.com

ubuntu@pihole001:~$ echo ">top-ads >quit" | nc localhost 4711
0 21173 telemetry.acronis.com
1 814 mask.icloud.com
2 715 api.segment.io
3 116 incoming.telemetry.mozilla.org
4 76 mask-h2.icloud.com
5 66 metrics.icloud.com
6 59 www.googletagmanager.com
7 52 prg.smartadserver.com
8 32 device-metrics-us-2.amazon.com
9 31 fastlane.rubiconproject.com

ubuntu@pihole001:~$ echo ">top-clients >quit" | nc localhost 4711
0 48547 192.168.1.136
1 5581 :: pi.hole
2 3510 192.168.1.185
3 1470 192.168.1.1 setup.ui.com
4 1467 192.168.1.175
5 946 192.168.1.162
6 875 127.0.0.1 pihole001
7 759 192.168.1.155
8 421 192.168.1.166
9 198 192.168.1.186
ubuntu@pihole001:~$

For Pi-hole to report that warning, its host's system time has to lag behind.
You wouldn't run your Pi-hole on hardware without a battery-backuped RTC, e.g. a Raspberry Pi? Those are susceptible to time lags, especially after a reboot or a longer powerdown.

Your spike seems mainly to be caused by requests for the following domain:

Likely issued by the following client:

Inaccurate timings after a reboot may over-emphasise the number of queries, as your host would virtually be going through the same time period twice.

Correct, I am running Pi-hole on a Raspberry Pi 4, I will look at adding some NTP servers?

I did notice "telemetry.acronis.com" - obviously I don't want to whitelist this but can I suppress the message?

Thank you once again!

As an alternative, you can try to install fake-hwclock on your system.

https://manpages.ubuntu.com/manpages/bionic/man8/fake-hwclock.8.html

Note:
fake-hwclock will not adjust your system clock on startup, but will avoid jumping to past/future times on startup

Thank you - looking at this now!

Your Pi-hole is reporting about a day's difference, so I guess your system is already using a file-based time-keeping approach, lest I'd expect the system time would jump from 1970 to current in the absence of any time information at boot.

To avoid potential conflicts, you may want to verify if Ubuntu wouldn't already employ systemd-timesyncd's /var/lib/systemd/timesync/clock for the same purpose. On more recent releases, that may be further controllable via SaveIntervalSec.
If that option would not be available on your system, fake-hwclock would be the superior approach. At least on RPiOS, fake-hwclock would be storing time every hour and on controlled shutdowns.

Still, note that installing fake-hwclock would not be able to mitigate timing issues completely, see also Internet not working on Pihole DNS - #4 by Bucking_Horn.

You may consider fitting an RTC to your RPi - a DS3231 is quite reliable for its low price tag of a few bucks only.

This topic was automatically closed 30 days after the last reply. New replies are no longer allowed.