Pi-Hole not working

Hi,

I'm new to this pi-hole wonder and, while I've been following other help guidelines and setups, I am yet to make it work.

I have an ISP modem/router (Ziggo Connectbox, Dutch) that does allow me to change DNS or turn IPV6 off. I've turned DHCP off am using Pi-Hole DHCP. I have raspbians, macs, android and iphone and the Pi-Hole is not filterind ads out

Can you help me check what I'm doing wrong?

Please follow the below template, it will help us to help you!

Expected Behaviour:

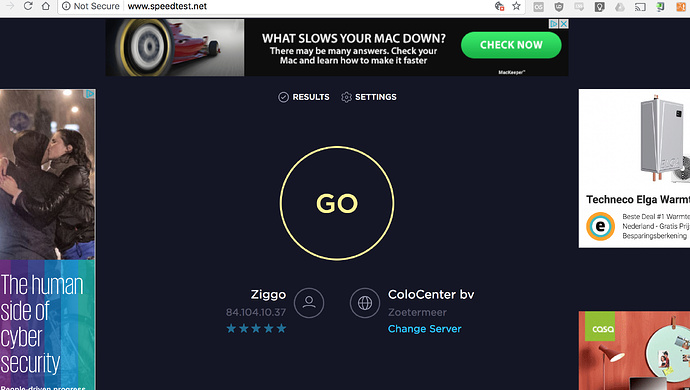
When I go to speedtest.net, I expect all ads to be filtered out

Actual Behaviour:

No filtering is done

dnsthingy on Chrome

  • secure-us.imrworldwide.com
  • www.speedtest.net
  • track.adform.net
  • pagead2.googlesyndication.com
  • www.googletagmanager.com
  • zdstatic.speedtest.net
  • securepubads.g.doubleclick.net
  • c.evidon.com
  • cdn.static.zdbb.net
  • sb.scorecardresearch.com
  • b.cdnst.net
  • l.betrad.com
  • www.google-analytics.com
  • connect.facebook.net
  • gurgle.zdbb.net
  • zdbb.net
  • b.scorecardresearch.com
  • tags.bluekai.com
  • stats.g.doubleclick.net
  • www.google.com
  • www.facebook.com
  • fastlane.rubiconproject.com
  • ib.adnxs.com
  • www.google.nl
  • cdn-gl.imrworldwide.com
  • adserver-us.adtech.advertising.com
  • tpc.googlesyndication.com
  • speedtest.alb-dp1.qweb.net.prod.hosts.ooklaserver.net
  • speedtest.ams1.nl.leaseweb.net
  • cdn.ampproject.org
  • googleads.g.doubleclick.net
  • fonts.googleapis.com
  • fonts.gstatic.com
  • googleads4.g.doubleclick.net
  • eus.rubiconproject.com
  • geo.moatads.com
  • ad.doubleclick.net
  • s.update.rubiconproject.com
  • rtb-xv.openx.net
  • adservice.google.com
  • ziffdavis697674298673.s.moatpixel.com
  • adservice.google.nl
  • choices.truste.com
  • us-u.openx.net
  • s0.2mdn.net
  • match.prod.bidr.io
  • ox.pxl.ace.advertising.com
  • eu-u.openx.net
  • s.amazon-adsystem.com
  • choices.trustarc.com
  • px.moatads.com

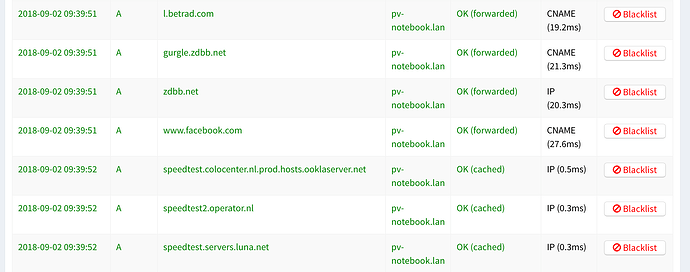
Pi-Hole Console (Example):

Debug Token:

[βœ“] Your debug token is: lv9f9owxbb

Hi,

i think you have a configuration issue. Could you check the following please...

Check the IP of your pihole. Open a terminal on your mac and type "nslookup" there. The result is the DNS server name and IP the mac use. That should be the address of the pihole. Could you agree that?

BR

The pi-hole is on a raspi. Running this from the machine that has pi-hole:

$ nslookup pi.hole
Server:		127.0.0.1
Address:	127.0.0.1#53

Name:	pi.hole
Address: 192.168.178.7

Running it from the laptop:

$ nslookup pi.hole
Server:		192.168.178.7
Address:	192.168.178.7#53

Name:	pi.hole
Address: 192.168.178.7

The mac system information shows

Pv4 Addresses:	192.168.178.38
IPv4:
 AdditionalRoutes:
  DestinationAddress:	192.168.178.38
  SubnetMask:	255.255.255.255
  DestinationAddress:	169.254.0.0
  SubnetMask:	255.255.0.0
  Addresses:	192.168.178.38
  ARPResolvedHardwareAddress:	XXXXX
  ARPResolvedIPAddress:	192.168.178.1
  Configuration Method:	DHCP
  ConfirmedInterfaceName:	en0
  Interface Name:	en0
  Network Signature:	IPv4.Router=192.168.178.1;    IPv4.RouterHardwareAddress=XXXX
  Router:	192.168.178.1
  Subnet Masks:	255.255.255.0
  DNS:
  Domain Name:	lan
  Server Addresses:	192.168.178.7
  DHCP Server Responses:
  Domain Name:	lan
  Domain Name Servers:	192.168.178.7
  Lease Duration (seconds):	0
  DHCP Message Type:	0x05
  Routers:	192.168.178.1
  Server Identifier:	192.168.178.7
  Subnet Mask:	255.255.255.0

I turned off ipv6 on the mac but, as mentioned, i cannot do it on the modem

Hey,

i told to run "nslookup" without anything to find out what DNS server your device using.

To turn ipv6 on mac of you need to deactivate it via terminal: "networksetup -setv6off en0"

BR

Bear with me. When I run nslookup on the mac terminal, I get a > for input…

unless you mean this?

$ nslookup speedtest.net
Server:		192.168.178.7
Address:	192.168.178.7#53

Non-authoritative answer:
Name:	speedtest.net
Address: 151.101.194.219
Name:	speedtest.net
Address: 151.101.130.219
Name:	speedtest.net
Address: 151.101.66.219
Name:	speedtest.net
Address: 151.101.2.219

You retrieved the data correctly.

Your Pi-Hole IP address is 192.168.178.7
your Mac is at IP 192.168.178.38
The router is at IP 192.168.178.1
The DNS server shown for your Mac is 192.168.178.7 (this is the Pi-Hole)

We'll take a look at your debug log and see if the Pi-Hole has any problems. Then we'll look at the router for any bypasses around the Pi-Hole, then at clients.

For now, please run the following commands from the Pi terminal and paste the results:

dig flurry.com - this is a known ad-serving site and should be blocked

dig flurry.com @1.1.1.1 - this looks for the same site, but directly from Cloudflare and should return the actual IP address.

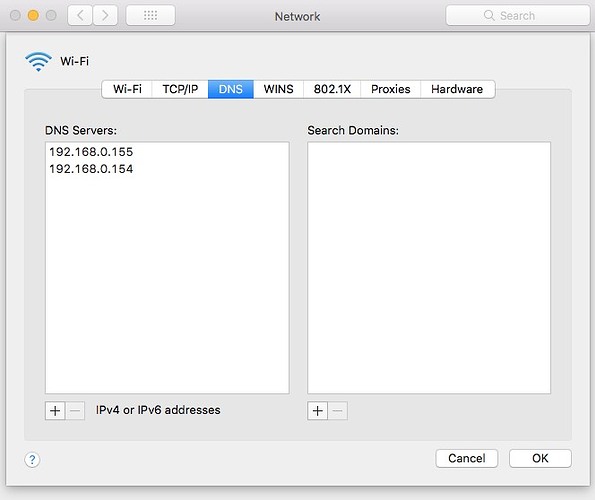
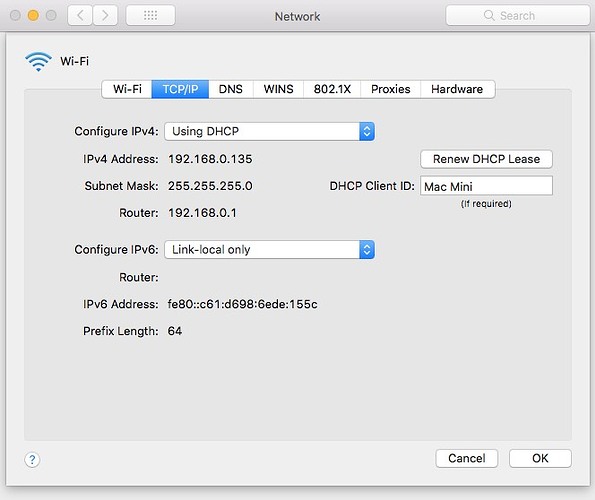
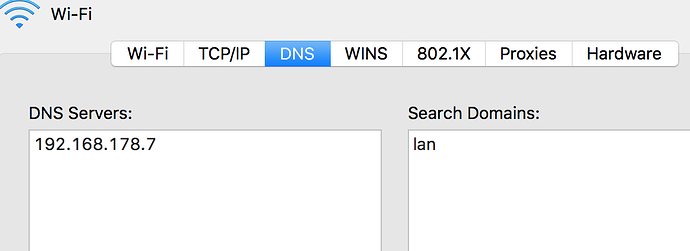
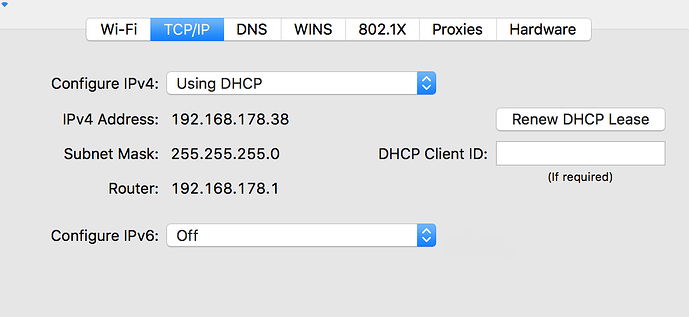
Also, from your Mac network preference panel, please paste your screens similar to what I show below:

Network - advanced - DNS:

Network - advanced - TCP/IP:

$ dig flurry.com

; <<>> DiG 9.10.3-P4-Raspbian <<>> flurry.com
;; global options: +cmd
;; Got answer:
;; ->>HEADER<<- opcode: QUERY, status: NOERROR, id: 1512
;; flags: qr rd ra; QUERY: 1, ANSWER: 3, AUTHORITY: 0, ADDITIONAL: 1

;; OPT PSEUDOSECTION:
; EDNS: version: 0, flags:; udp: 4096
;; QUESTION SECTION:
;flurry.com.			IN	A

;; ANSWER SECTION:
flurry.com.		197	IN	A	98.136.103.26
flurry.com.		197	IN	A	74.6.136.153
flurry.com.		197	IN	A	212.82.100.153

;; Query time: 1 msec
;; SERVER: 127.0.0.1#53(127.0.0.1)
;; WHEN: Sun Sep 02 15:57:42 CEST 2018
;; MSG SIZE  rcvd: 87
$ dig flurry.com @1.1.1.1

; <<>> DiG 9.10.3-P4-Raspbian <<>> flurry.com @1.1.1.1
;; global options: +cmd
;; Got answer:
;; ->>HEADER<<- opcode: QUERY, status: NOERROR, id: 73
;; flags: qr rd ra; QUERY: 1, ANSWER: 3, AUTHORITY: 0, ADDITIONAL: 1

;; OPT PSEUDOSECTION:
; EDNS: version: 0, flags:; udp: 1452
;; QUESTION SECTION:
;flurry.com.			IN	A

;; ANSWER SECTION:
flurry.com.		246	IN	A	98.136.103.26
flurry.com.		246	IN	A	212.82.100.153
flurry.com.		246	IN	A	74.6.136.153

;; Query time: 15 msec
;; SERVER: 1.1.1.1#53(1.1.1.1)
;; WHEN: Sun Sep 02 15:58:53 CEST 2018
;; MSG SIZE  rcvd: 87

OK. The dig commands match your debug log - Pi-Hole is not filtering DNS requests. The first command should have returned 0.0.0.0, not the actual IP address.

What is the output of cat /etc/resolv.conf

When started creating the post, I decide to investigate other machines connected and it's all different. So I've put some more information to see if it helps identifying the problem.

pv-notebook

On the mac laptop :

$ cat /etc/resolv.conf
#
# macOS Notice
#
# This file is not consulted for DNS hostname resolution, address
# resolution, or the DNS query routing mechanism used by most
# processes on this system.
#
# To view the DNS configuration used by this system, use:
#   scutil --dns
#
# SEE ALSO
#   dns-sd(1), scutil(8)
#
# This file is automatically generated.
#
domain lan
nameserver 192.168.178.7

brain

On the pi-hole, on 192.168.178.7

cat /etc/resolv.conf
# Dynamic resolv.conf(5) file for glibc resolver(3) generated by resolvconf(8)
#     DO NOT EDIT THIS FILE BY HAND -- YOUR CHANGES WILL BE OVERWRITTEN
nameserver 127.0.0.1

But, on another raspi (192.168.178.5) I get different information. Is it relevant?

$ cat /etc/resolv.conf
# Generated by resolvconf
nameserver 192.168.178.1
nameserver 2001:b88:1002::10
nameserver 2001:b88:1202::10
nameserver 2001:730:3e42:1000::53
nameserver 2001:1c00:1f02:7f00:4c13:1ca3:efd2:a60c
# Dynamic resolv.conf(5) file for glibc resolver(3) generated by resolvconf(8)
#     DO NOT EDIT THIS FILE BY HAND -- YOUR CHANGES WILL BE OVERWRITTEN
nameserver 127.0.0.1

soul

Well, here's the output of the other commands on the 192.168.178.5 (my seedbox), just in case

$ dig flurry.com

; <<>> DiG 9.10.3-P4-Raspbian <<>> flurry.com
;; global options: +cmd
;; Got answer:
;; ->>HEADER<<- opcode: QUERY, status: NOERROR, id: 49743
;; flags: qr rd ra; QUERY: 1, ANSWER: 3, AUTHORITY: 0, ADDITIONAL: 1

;; OPT PSEUDOSECTION:
; EDNS: version: 0, flags:; udp: 4096
;; QUESTION SECTION:
;flurry.com.			IN	A

;; ANSWER SECTION:
flurry.com.		300	IN	A	74.6.136.153
flurry.com.		300	IN	A	98.136.103.26
flurry.com.		300	IN	A	212.82.100.153

;; Query time: 42 msec
;; SERVER: 2001:b88:1002::10#53(2001:b88:1002::10)
;; WHEN: Sun Sep 02 21:52:33 CEST 2018
;; MSG SIZE  rcvd: 87

And the one with the @1.1.1.1

dig flurry.com @1.1.1.1

; <<>> DiG 9.10.3-P4-Raspbian <<>> flurry.com @1.1.1.1
;; global options: +cmd
;; Got answer:
;; ->>HEADER<<- opcode: QUERY, status: NOERROR, id: 48859
;; flags: qr rd ra; QUERY: 1, ANSWER: 3, AUTHORITY: 0, ADDITIONAL: 1

;; OPT PSEUDOSECTION:
; EDNS: version: 0, flags:; udp: 1452
;; QUESTION SECTION:
;flurry.com.			IN	A

;; ANSWER SECTION:
flurry.com.		224	IN	A	74.6.136.153
flurry.com.		224	IN	A	98.136.103.26
flurry.com.		224	IN	A	212.82.100.153

;; Query time: 16 msec
;; SERVER: 1.1.1.1#53(1.1.1.1)
;; WHEN: Sun Sep 02 21:54:13 CEST 2018
;; MSG SIZE  rcvd: 87

osmc

Finally, on my OSMC raspi (192.168.178.6), I get yet different data

$ cat /etc/resolv.conf 
# Generated by Connection Manager
nameserver 8.8.8.8
nameserver 84.116.46.20

So, here are the same commands as before (had to run sudo apt-get install dnsutils first)

$ dig flurry.com

; <<>> DiG 9.10.3-P4-Debian <<>> flurry.com
;; global options: +cmd
;; Got answer:
;; ->>HEADER<<- opcode: QUERY, status: NOERROR, id: 48864
;; flags: qr rd ra; QUERY: 1, ANSWER: 3, AUTHORITY: 0, ADDITIONAL: 1

;; OPT PSEUDOSECTION:
; EDNS: version: 0, flags:; udp: 512
;; QUESTION SECTION:
;flurry.com.			IN	A

;; ANSWER SECTION:
flurry.com.		299	IN	A	212.82.100.153
flurry.com.		299	IN	A	74.6.136.153
flurry.com.		299	IN	A	98.136.103.26

;; Query time: 24 msec
;; SERVER: 8.8.8.8#53(8.8.8.8)
;; WHEN: Sun Sep 02 22:13:01 CEST 2018
;; MSG SIZE  rcvd: 87

And now with @1.1.1.1

$ dig flurry.com @1.1.1.1

; <<>> DiG 9.10.3-P4-Debian <<>> flurry.com @1.1.1.1
;; global options: +cmd
;; Got answer:
;; ->>HEADER<<- opcode: QUERY, status: NOERROR, id: 51651
;; flags: qr rd ra; QUERY: 1, ANSWER: 3, AUTHORITY: 0, ADDITIONAL: 1

;; OPT PSEUDOSECTION:
; EDNS: version: 0, flags:; udp: 1452
;; QUESTION SECTION:
;flurry.com.			IN	A

;; ANSWER SECTION:
flurry.com.		276	IN	A	74.6.136.153
flurry.com.		276	IN	A	98.136.103.26
flurry.com.		276	IN	A	212.82.100.153

;; Query time: 15 msec
;; SERVER: 1.1.1.1#53(1.1.1.1)
;; WHEN: Sun Sep 02 22:13:34 CEST 2018
;; MSG SIZE  rcvd: 87

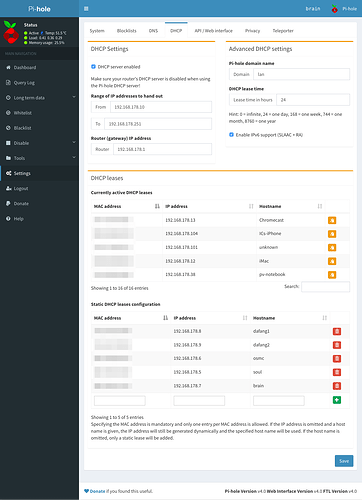
dhcp configuration on pi-hole (soul)
The Pi-Hole Pi is set up correctly to use itself as the name server. The first other Pi is using the router, which I assume is pointing to the Pi-Hole; and the OSMC is going directly to Google DNS.

What is the output of this command on the Pi terminal for the Pi-Hole host:

echo ">stats" | nc localhost 4711

I'm not seeing anything obvious in your debug log that shows why the Pi-Hole isn't working. Run the following commands and see if any blocking happens afterward (re-run the dig flurry command from the Pi).

pihole -g rebuilds the gravity list

sudo service pihole-FTL restart restarts FTL

Thanks for your help so far.
Here we go:

$ echo "&gt;stats" | nc localhost 4711
unknown command: &gt;stats

---EOM---

Was this expected, or did I miss something?
And the rebuild

$ pihole -g
  [i] Neutrino emissions detected...
  [βœ“] Pulling blocklist source list into range

  [i] Target: raw.githubusercontent.com (hosts)
  [βœ“] Status: Retrieval successful

  [i] Target: mirror1.malwaredomains.com (justdomains)
  [βœ“] Status: No changes detected

  [i] Target: sysctl.org (hosts)
  [βœ“] Status: No changes detected

  [i] Target: zeustracker.abuse.ch (blocklist.php?download=domainblocklist)
  [βœ“] Status: No changes detected

  [i] Target: s3.amazonaws.com (simple_tracking.txt)
  [βœ“] Status: No changes detected

  [i] Target: s3.amazonaws.com (simple_ad.txt)
  [βœ“] Status: No changes detected

  [i] Target: hosts-file.net (ad_servers.txt)
  [βœ“] Status: No changes detected

  [βœ“] Consolidating blocklists
  [βœ“] Extracting domains from blocklists
  [i] Number of domains being pulled in by gravity: 156860
  [βœ“] Removing duplicate domains
  [i] Number of unique domains trapped in the Event Horizon: 133680
  [i] Number of whitelisted domains: 0
  [i] Number of blacklisted domains: 0
  [i] Number of regex filters: 0
  [βœ“] Parsing domains into hosts format
  [βœ“] Cleaning up stray matter

  [βœ“] Force-reloading DNS service
  [βœ“] DNS service is running
  [βœ“] Pi-hole blocking is Enabled

After restarting FTL…

$ dig flurry.com

; <<>> DiG 9.10.3-P4-Raspbian <<>> flurry.com
;; global options: +cmd
;; Got answer:
;; ->>HEADER<<- opcode: QUERY, status: NOERROR, id: 7736
;; flags: qr aa rd ra; QUERY: 1, ANSWER: 1, AUTHORITY: 0, ADDITIONAL: 1

;; OPT PSEUDOSECTION:
; EDNS: version: 0, flags:; udp: 4096
;; QUESTION SECTION:
;flurry.com.			IN	A

;; ANSWER SECTION:
flurry.com.		2	IN	A	0.0.0.0

;; Query time: 0 msec
;; SERVER: 127.0.0.1#53(127.0.0.1)
;; WHEN: Mon Sep 03 18:39:31 CEST 2018
;; MSG SIZE  rcvd: 55

It seems that it is working now on the pihole, the mac, android and the iphone, but why do I have a (as you mentioned) DNS leak on the other pi (soul, 192.168.178.7)?

$ cat /etc/resolv.conf
# Generated by resolvconf
nameserver 192.168.178.1
nameserver 2001:b88:1002::10
nameserver 2001:b88:1202::10
nameserver 2001:730:3e42:1000::53
nameserver 2001:1c00:1f02:7f00:4c13:1ca3:efd2:a60c

How do I change it?

I posted a bad command with some stray formatting in it. It should have been
echo ">stats" | nc localhost 4711
This shows the output you would get with pihole -c (a summary of activity, blocks, queries, domains, etc.) I corrected it in my original reply so nobody else will try the errant command.

Good. I think the restart fixed it.

I'm not sure why it is set up this way, but you can edit the name server file on that Pi and point it to your Pi-Hole. Change the first name server to the Pi-Hole IP and eliminate the rest.

1 Like

Understood. Thanks for your help.

BTW, here's the output:

$ echo ">stats" | nc localhost 4711
domains_being_blocked 133680
dns_queries_today 58634
ads_blocked_today 2103
ads_percentage_today 3.586656
unique_domains 1397
queries_forwarded 9623
queries_cached 46907
clients_ever_seen 40
unique_clients 32
dns_queries_all_types 58864
reply_NODATA 2819
reply_NXDOMAIN 130
reply_CNAME 1730
reply_IP 8900
status enabled
---EOM---

This topic was automatically closed 21 days after the last reply. New replies are no longer allowed.