Pi-hole I/O > 2x dnsmasq

  1. /etc/pihole/pihole-FTL.db gets written every minute

  2. pi-hole ftl writes more to disk than dnsmasq itself

root@debian:~# service pihole-FTL status
pihole-FTL.service - LSB: pihole-FTL daemon
Loaded: loaded (/etc/init.d/pihole-FTL; generated; vendor preset: enabled)
Active: active (exited) since Sat 2017-06-24 17:10:07; 1 weeks 1 days ago
Docs: man:systemd-sysv-generator(8)
Process: 392 ExecStart=/etc/init.d/pihole-FTL start (code=exited, status=0/SUCCESS)
Tasks: 0 (limit: 4915)
CGroup: /system.slice/pihole-FTL.service
Warning: Journal has been rotated since unit was started. Log output is incomplete or unavailable.
root@debian:~# cat /proc/509/io
rchar: 1305914583
wchar: 730089438
syscr: 934799
syscw: 612341
read_bytes: 53538816
write_bytes: 5942308864
cancelled_write_bytes: 0

Run pihole -d for a debug token.

I don't understand: Do you simply want to point that out or do you want to say that this is bad?

AFAIK, pihole-FTL does only append to the database if new queries are available. In contrast to an immediate writing to disk (as dnsmasq does), FTL collects the queries for one minute and writes them in one batch at the end of the minute). It is not like the database is re-written altogether every minute.

My pihole-FTL.db is ~25 MB, pihole.log is ~10 MB, pihole-FTL.log is ~8 KB, which is the maximum size these files would get over a 24 hour period. But cat /proc/509/io works out to ~740 MB written in 24 hours -- that's ~700 MB more than I'd expect. Am I measuring this right or do I not know how pihole works? Why does it write so much?
In case this is an isolated case, I generated a debug (but it didn't upload..tried twice) https://pastebin.com/raw/7pFKHBva

Locally, I see

$ cat /proc/$(pidof pihole-FTL)/io
rchar: 19814428
wchar: 6997499
syscr: 15012
syscw: 22515
read_bytes: 0
write_bytes: 16945152
cancelled_write_bytes: 0

on my machine where FTL is running for a longer time without interruption. My database file is about 16 MB.

Note that /proc/[PID]/io sums up all write data, including data that was send through the Linux socket to the API. If you have your dashboard open for a long time (parts of it update every second) that will produce quite some data. But rest assured that they never touch your SD card if that is your concern.

I can confirm that write_bytes of pihole-FTL is to the disk because iostat indicates a corresponding increase in kB_wrtn to sda. The amount of writes to /sda would only make sense if I add the writes of dnsmasq and pihole (and then some more). I also tested on a fresh CentOS plus Pi-hole installation with everything default, and I have similar readings. My tests are only on VMs in ESXi.

Can you determine where these write go to on the disk (which file)?

I couldn't find any tool that will show i/o stats for files. Only for drives and processes. However I'm finding iotop -a useful.

I have this running for about half an hour by now and haven't seen anything interesting or outstanding on my Pi-hole. The majority of writes is done by lighttpd, php-cgi, dnsmasq, and rsyslogd.

I'm not even sure if it is doing the correct thing here:


whereas

In the very same time period, FTL has written more than 500 queries to the database file and I can confirm that they have actually been written there.

Journaling
iotop revealed the service btrfs-transacti writing the most. I chose btrfs over ext4 over both VMs for the sake of testing. (I should have known "if it ain't broke, don't fix it") This could be mitigated by adding "nodatacow" to fstab. I installed my VM on ext2 to rule out any journaling overhead that ext4 or btrfs might have.

iostat/sysstat
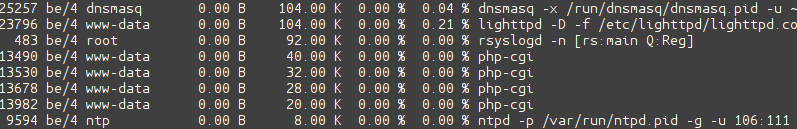
One thing to note is that, pihole's write stat is always zero in iotop. Besides that, in all of the VMs I made, pihole's write_bytes is more than double that of dnsmasq. Furthermore, writes to /sda could be explained only by adding those two, because if it wasn't for pihole write stats, over 50% of writes to /sda is unaccounted for.

iostat -m

Linux 4.9.0-3-amd64 (pid)       07/06/2017      _x86_64_        (1 CPU)
avg-cpu:  %user   %nice %system %iowait  %steal   %idle
           0.40    0.00    0.15    0.02    0.00   99.43
Device:            tps    MB_read/s    MB_wrtn/s    MB_read    MB_wrtn
sda               0.43         0.00         0.00        136        159

cat /proc/$(pidof dnsmasq)/io

rchar: 1040236
wchar: 6227861
syscr: 268
syscw: 85777
read_bytes: 1056768
write_bytes: 11218944
cancelled_write_bytes: 0

cat /proc/$(pidof pihole-FTL)/io

rchar: 75082562
wchar: 42972015
syscr: 58405
syscw: 23558
read_bytes: 4812800
write_bytes: 54169600
cancelled_write_bytes: 0

More finding
Additionally, I did a systemtap trace to get some realistic I/O numbers and it tells a similar story. I printed out the filesizes after the trace was stopped, and dnsmasq's io & filesize are accurate.

 643            sshd r:      653 KiB w:        1 MiB
 584              DB r:      462 KiB w:      979 KiB
 584     loganalyzer r:        1 MiB w:        0   B
 657          stapio r:      603 KiB w:      627 KiB
 692            sshd r:      798 KiB w:       29 KiB
 251        vmtoolsd r:      591 KiB w:        0   B
 556         dnsmasq r:        0   B w:      259 KiB
 594        lighttpd r:      193 KiB w:       32 KiB
 712            sshd r:      130 KiB w:       46 KiB
 703            cron r:       59 KiB w:        1   B
^Cls -lh /etc/pihole/pihole-FTL.db /var/log/pihole-FTL.log /var/log/pihole.logroot@debian7:~# ls -lh /etc/pihole/pihole-FTL.db /var/log/pihole-FTL.log /var/log/pihole.log
-rw-r--r-- 1 pihole  pihole  60K Jul  6 04:37 /etc/pihole/pihole-FTL.db
-rw-r--r-- 1 pihole  pihole 4.6K Jul  6 04:17 /var/log/pihole-FTL.log
-rw-r--r-- 1 dnsmasq root   276K Jul  6 04:37 /var/log/pihole.log

traceio cumulative systemtap script https://access.redhat.com/documentation/en-US/Red_Hat_Enterprise_Linux/5/html/SystemTap_Beginners_Guide/traceiosect.html


If anybody else would like to find out (and share) what their stats look like that would be helpful.

[details=Try this]install

apt-get update && apt-get install sysstat iotop -y

Uptime, total write to partition, writes by dnsmasq, followed by pihole-ftl

uptime && iostat -m && cat /proc/$(pidof dnsmasq)/io && echo && cat /proc/$(pidof pihole-FTL)/io
ls -lh /etc/pihole/pihole-FTL.db /var/log/pihole-FTL.log /var/log/pihole.log

Keep running to see top writes

iotop -a[/details]

I'am running the PiHole on a RaspberryPi3 with jessi-lite.
My pihole-FTL.db is 3.780 kB
There are 58388 records in the query table.
I have about 3000 queries a day, about 38% of these are blocked. Top blocked domains are not necessary Avast sites and Google smartphone related sites. But also about 550 top domains a day of the same smartphone.

sudo iostat -m
Linux 4.9.24-v7+ (raspberrypi) 06/07/17 armv7l (4 CPU)

avg-cpu:  %user   %nice %system %iowait  %steal   %idle
           0.45    0.00    0.34    0.06    0.00   99.14

Device:            tps    MB_read/s    MB_wrtn/s    MB_read    MB_wrtn
mmcblk0           0.67         0.00         0.02        533      15198

sudo cat /proc/$(pidof dnsmasq)/io

rchar: 59136222
wchar: 309510
syscr: 14454
syscw: 3825
read_bytes: 0
write_bytes: 0
cancelled_write_bytes: 0

sudo cat /proc/$(pidof pihole-FTL)/io

rchar: 2611051672
wchar: 578375154
syscr: 965422
syscw: 2087606
read_bytes: 33734656
write_bytes: 673734656
cancelled_write_bytes: 0

sudo iotop -a -o -P
running for 15 minutes

Total DISK READ :       0.00 B/s | Total DISK WRITE :       3.64 K/s
Actual DISK READ:       0.00 B/s | Actual DISK WRITE:       0.00 B/s
  PID  PRIO  USER     DISK READ  DISK WRITE  SWAPIN     IO>    COMMAND
   94 be/3 root          0.00 B   1040.00 K  0.00 %  0.12 % [jbd2/mmcblk0p2-]
13869 be/4 www-data      0.00 B     28.00 K  0.00 %  0.00 % php-cgi
14062 be/4 www-data      0.00 B     32.00 K  0.00 %  0.00 % php-cgi
  794 be/4 ntp           0.00 B      4.00 K  0.00 %  0.00 % ntpd -p /var/run/ntpd.pid -g -u 106:111
13969 be/4 www-data      0.00 B     36.00 K  0.00 %  0.00 % php-cgi
14210 be/4 www-data      0.00 B     40.00 K  0.00 %  0.00 % php-cgi
  909 be/4 root          0.00 B     12.00 K  0.00 %  0.00 % perl /usr/share/webmin/mi~ /etc/webmin/miniserv.conf

sudo ls -lh /etc/pihole/pihole-FTL.db /var/log/pihole-FTL.log /var/log/pihole.log

-rw-r--r-- 1 pihole root 3.8M Jul 6 23:49 /etc/pihole/pihole-FTL.db
-rw-r--r-- 1 pihole pihole 2.9K Jul 6 15:56 /var/log/pihole-FTL.log
-rw-r--r-- 1 dnsmasq root 678K Jul 6 23:48 /var/log/pihole.log

Now my pihole-FTL.db is 3.792 kB and there are 58485 records in the query table.
So 97 records are written in these 15 minutes.

1 Like

Since the dnsmasq r/w is zero, I assume the RPi's /var/log is in a tmpfs or ram disk? I suppose the pihole-FTL's high writes could possibly be attributed to the way sqlite works.

Sorry, forgotten to wrote above.
I use Log2Ram (GitHub - azlux/log2ram: ramlog like for systemd (Put log into a ram folder)) for /var/log. It's working fine.

(I have seen that dnsmasq r/w is zero, but I don't why. The PiHole is my first linux project.)

This is very strange, but it is rather an issue with iotop than anything else. I suppose that the option -P

       -P, --processes
              Only show processes. Normally iotop shows all threads.

does not sum up the contributions of the individual threads but only shows the I/O of FTL's main process which is expected to be zero or at least extremely small as all of the interesting stuff is handled by thread workers.

I forgot to mention that loganalyzer and DB in the systemtap is pihole. DB wrote the most, as you can see.

It seems to be an intrinsic problem of SQLite. Do you have any suggestions on how to improve this?

What we already do it enclosing the inserts into transactions to minimize the amount of I/O generated by SQLite (it will only write once after collecting a lot of queries instead of performing a database action for each individual entry).

Maybe move the DB to var/log and those whose var/log is volatile, add an option to save it before shutdown?

I see a problem here as the database can easily grow up to several hundreds of megabytes in size if you let it record all queries for a very long period in time (image a year or more). Users might power down the device too soon, because they don't expect the shutdown to take that long.

Have you experimented with a symlink from /etc/pihole/pihole-FTL.db to somewhere else?

However, putting the long-term statistics database into some directory that is volatile just sounds wrong (I know, putting it into /etc may not be any better following LFH).

I did not try symlink because I'm not concerned about disk-life as much as I'm concerned about efficiency. I only suggested tmpfs as a hack-fix for the inefficiency.