Device
Raspberry Pi 3 - Running Homebridge Raspberry Pi image
Expected Behaviour:
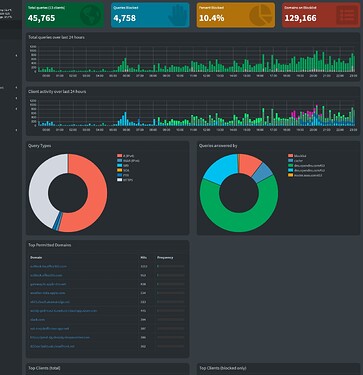
- The dashboard should be showing the "Top Blocked Domains" next to the "Top Perimitted Domains"
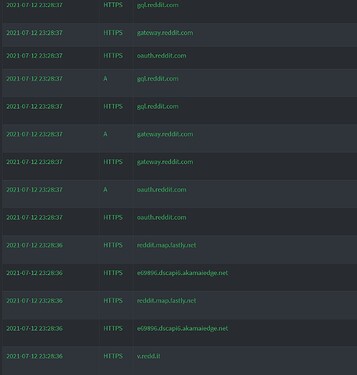
- The query log is supposed to show the recent queries, both allowed and blocked.
Actual Behaviour:
-
The dashboard does not show the table of "Top Blocked Domains" There is just a blank space next to the "Top Permitted Domains" table.
-
In the query log, only allowed queries are showing up, even when I can see the queries are being blocked via "pihole -t"
I know might seem incomplete but trust me, the query log only shows "allowed" or the green queries while pihole -t shows it is all working normally
Debug Token:
https://tricorder.pi-hole.network/6v264lvj1r
Likely Issue:
This is probably the portion of the debug log that is showing the issue
*** [ DIAGNOSING ]: Dashboard and block page
[✗] Block page X-Header: X-Header does not match or could not be retrieved.
HTTP/1.1 200 OK
Content-type: text/html; charset=UTF-8
Expires: Tue, 13 Jul 2021 06:34:25 GMT
Cache-Control: max-age=0
Date: Tue, 13 Jul 2021 06:34:25 GMT
Server: lighttpd/1.4.53
Solution:
I don't know, that's what I need help on... Corrupt file? Needs reinstallation? Please let me know


