Hi, i have a lagre setup on a large network, roundabout 1000000 querys on 24h.
So the issue is when i load the dashboard it takes minutes to show, i can activate pricacy ok that works a little bit, but its not optimal. We will have a lot statistic and when this is activatet the dashboard is loading very slow.
So the ide is to make a custom timerange as default in the dashboard so i can set this to the last time 1h, and the dashboard will load as default the history from the last 1h and not 24h
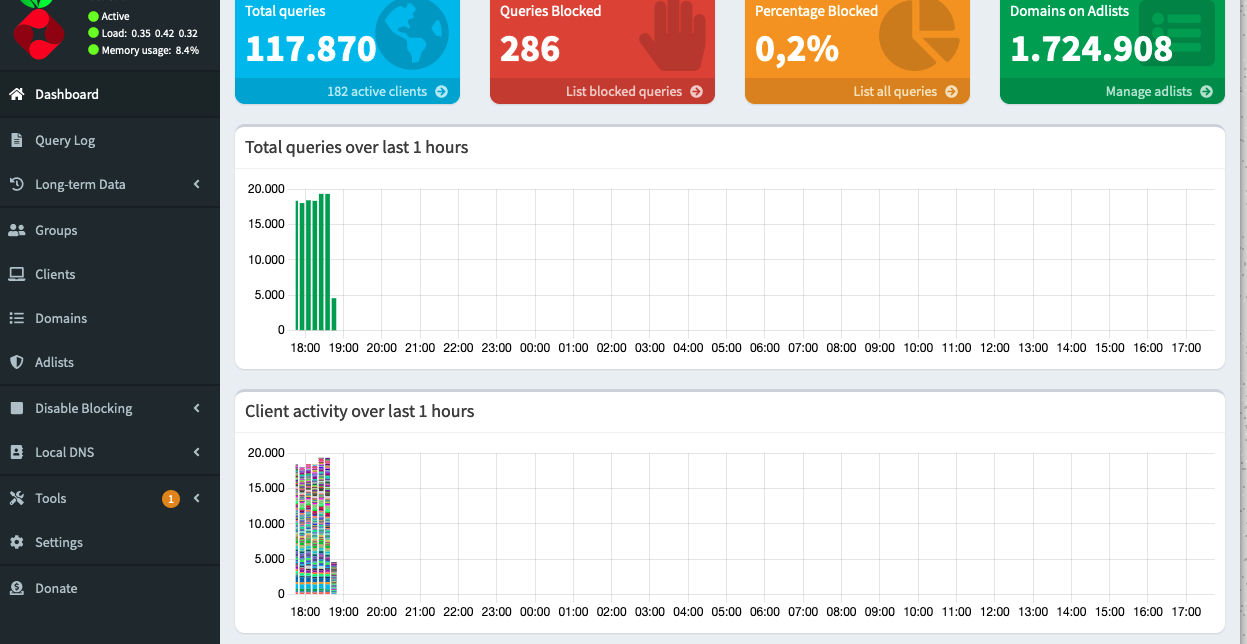
ok i can see the "Total queries over last 1 hours" it has changed from 24. But the timerange ha not changed. Is this option also working with the other graphs on the dashboard?
ok, is the setting also permanent ? i have made this in /etc/pihole/pihole-FTL.conf
#; Pi-hole FTL config file
#; Comments should start with #; to avoid issues with PHP and bash reading this file
PRIVACYLEVEL=0
RATE_LIMIT=1000/60
DBIMPORT=yes
MAXDBDAYS=7
MAXLOGAGE=1
The MAXLOGAGE=1 option is limiting the data to 1 hour (as expected), but the API command is still returning empty time slots to fill the 24 hours period.