I got a Zero W running for 30 days stay at 100 mb used, about 660k domains in list
echo ">stats" | nc localhost 4711
domains_being_blocked 112495
dns_queries_today 20883
ads_blocked_today 2375
ads_percentage_today 11.372887
unique_domains 2079
queries_forwarded 13955
queries_cached 4553
clients_ever_seen 11
unique_clients 11
dns_queries_all_types 20883
reply_NODATA 1954
reply_NXDOMAIN 1202
reply_CNAME 6631
reply_IP 7227
privacy_level 0
status enabled
---EOM---

I started at 25% a few days ago and I am now at 30% with stock settings. so I have to use "htop" and see for memory usage every few hours?
Every once in a while, just so you can see which process is using the increased memory.

Those percentages are within normal variance. Remember, it highly depends on how many queries have been made in the last 24 hours.
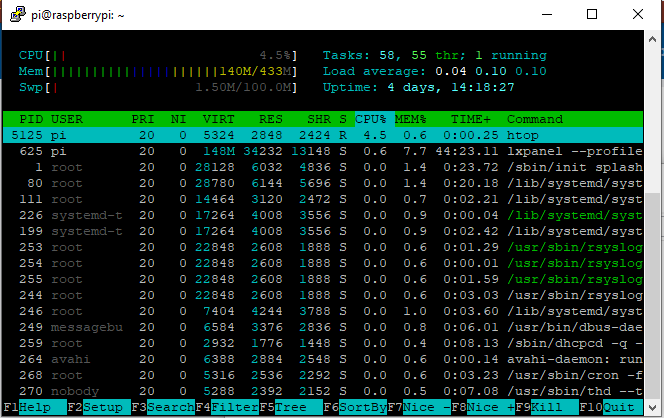
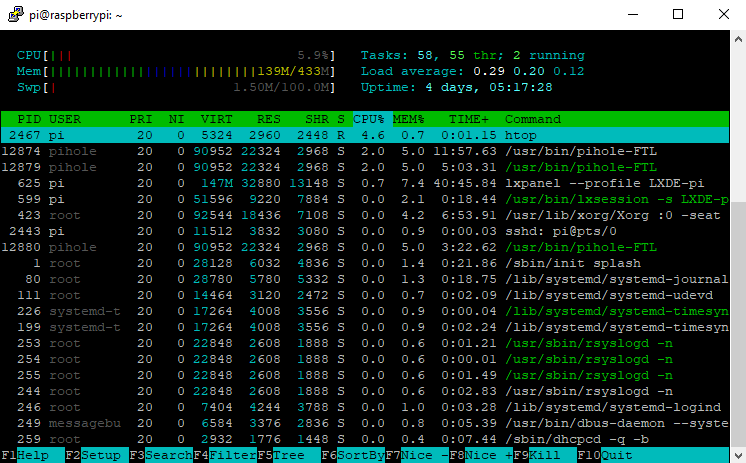
From your screen shots, we can't see which process is increasing memory use.
In the first screenshot, I see /usr/bin/pihole-FTL using 5.0%. In your second screenshot (1.5 days later) it is 5.1%. This doesn't tell too much.
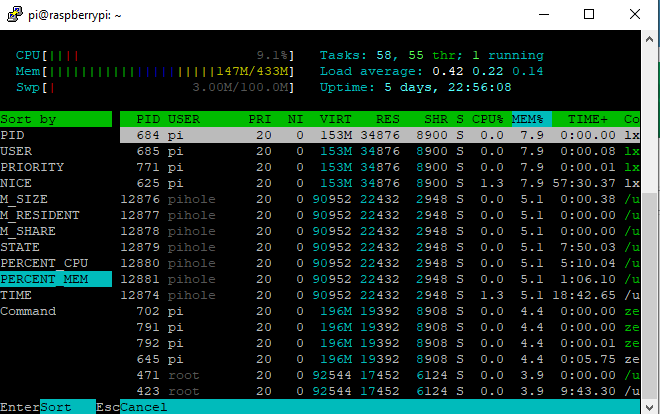
You can make the output much nicer if you
- Enable tree view (press F5).
- Filter by
pihole(press F4 and typepihole).
How's the status today?
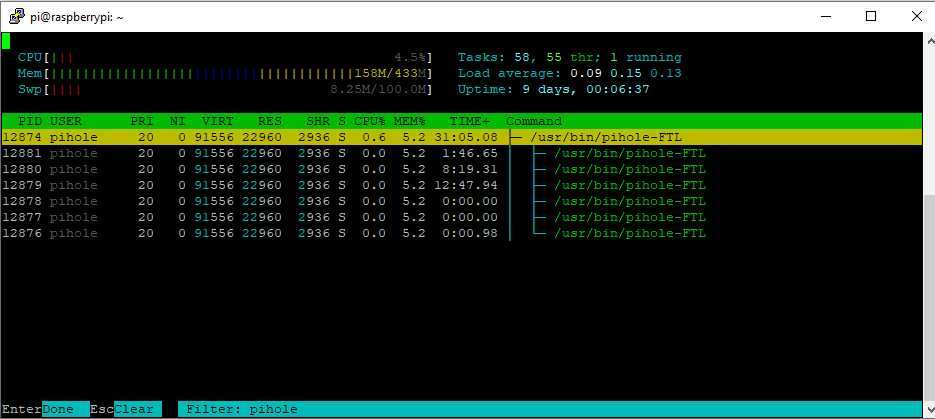
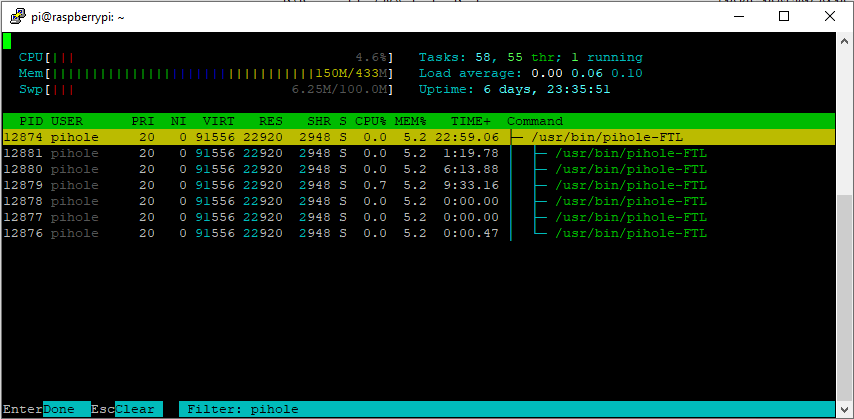
This is not caused by pihole-FTL as it seems. Look at the percentage shown in the MEM% column. pihole-FTL is still at 5.2% as it was two days ago.
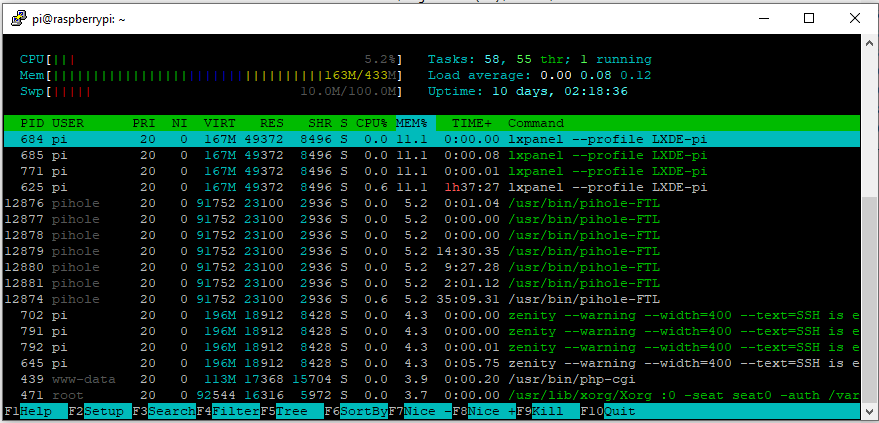
LXDE is the Linux desktop, so this software is part of the OS. If you have your Pi booting into the GUI rather than the command line, this could be initiating the problem.
If you run the Pi headless, then set it to boot to the command line.
I use the stock pi hole image and do not know what this is set to. I use the pi hole GUI over IP, the Pi itself has nothing connected to it (except for the usb to LAN adapter).
I am currently at 166MB memory usage. it increases about 5MB per day. is there nothing wrong on the screenshot? I am no expert, unfortunately and cannot spot the error:

You can disable the Raspbian GUI using
sudo raspi-config
by selecting
3 Boot Options -> B1 Desktop / CLI -> B1 Console -> <OK>
Agree to reboot your system when you're asked to (when leaving the config widget). After booting up, lxpanel should not be launched again.