Hi everyone,
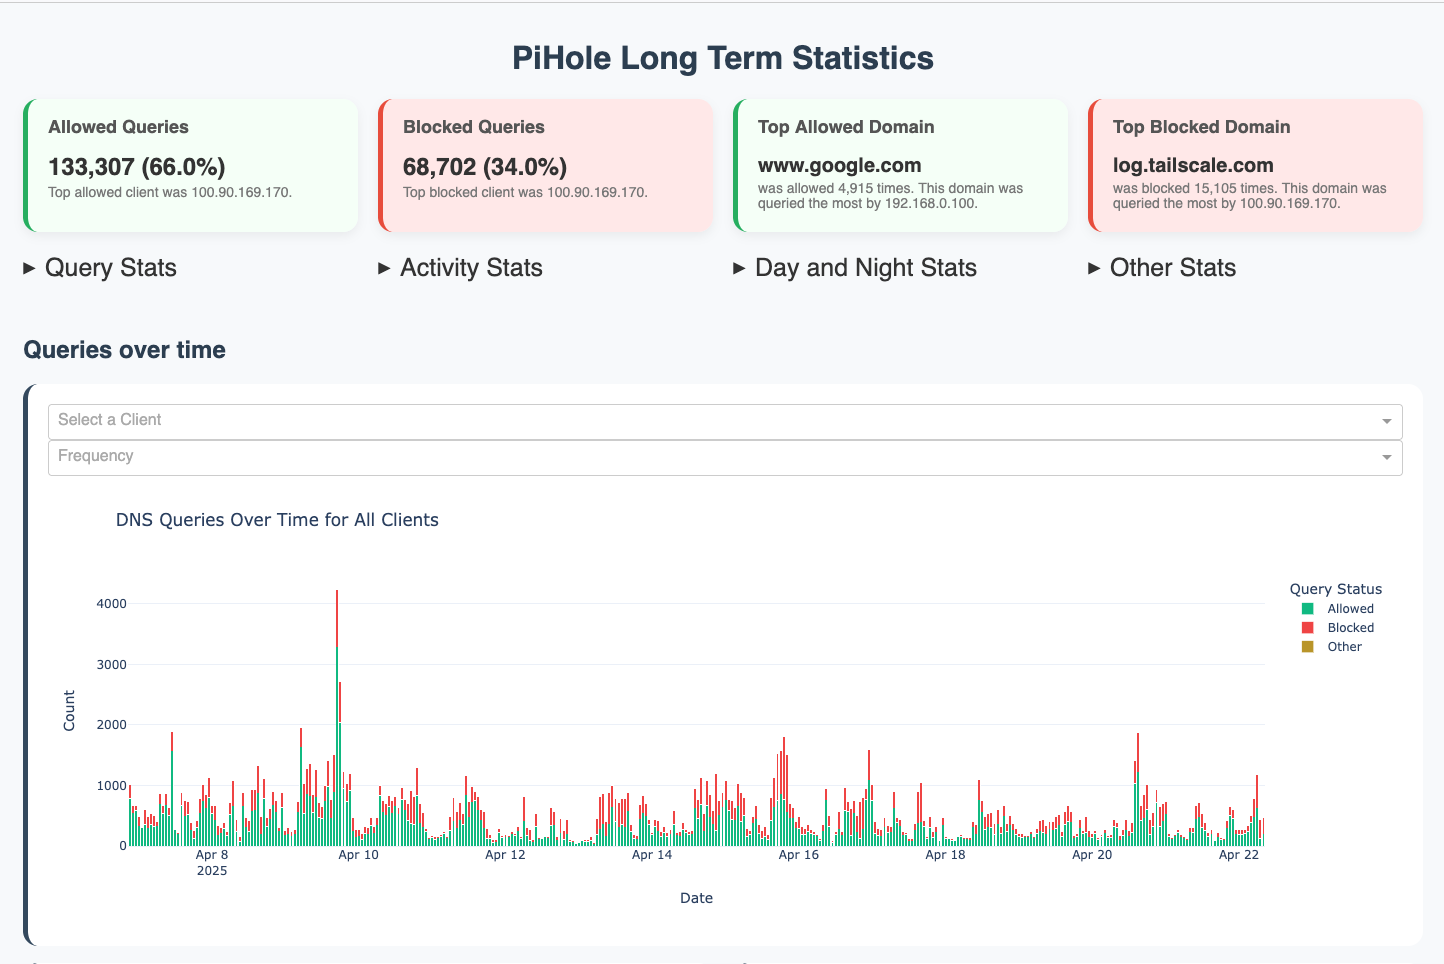
I have used Pi Hole for quite some time now and I wanted to share a project I have been working on which might also be useful to other Pi Hole users. It is a dashboard written in python using plotly and dash which can visualize long term statistics from a Pi Hole v6 FTL database file. Along with long term data charts, it also shows info cards with interesting statistics queried from a copy of the database file. I made this as I really liked the long-term statistics before v.6 and wanted to have something similar for personal use.
Here is the GitHub repo : GitHub - davistdaniel/PiHoleLongTermStats: A dashboard to visualize DNS query data from a Pi-hole v.6 FTL database file.