In v6 I miss the long-term data graphics and top lists.
I found this very useful to evaluate the impact of new lists and domain entries.
Confirmed. Same here.
BUT:
Go to => Query Log => Advanced filtering => select time period.
The query log is good for detailed analysis.
However, if I want to know whether a newly added list has an impact on the number of blocked domains, it is a bit tedious to do this via the query logs. The long-term data graphics and top lists provided a quick overview.
As a supplement, here is my related discussion on Reddit
https://www.reddit.com/r/pihole/comments/1ixr4z1/how_to_display_longer_time_period_statistics_in
I would like that feature as well, or a way to see something long term statistics at a glance.
I would like to have the Long term Top Lists from v5 as well
Me too. Was quiet sad when I heard that they removed this feature.
Agreed. It will be very useful to me.
This is great for fast troubleshooting, and I didn't even notice it's not ported to v6 till I needed it.
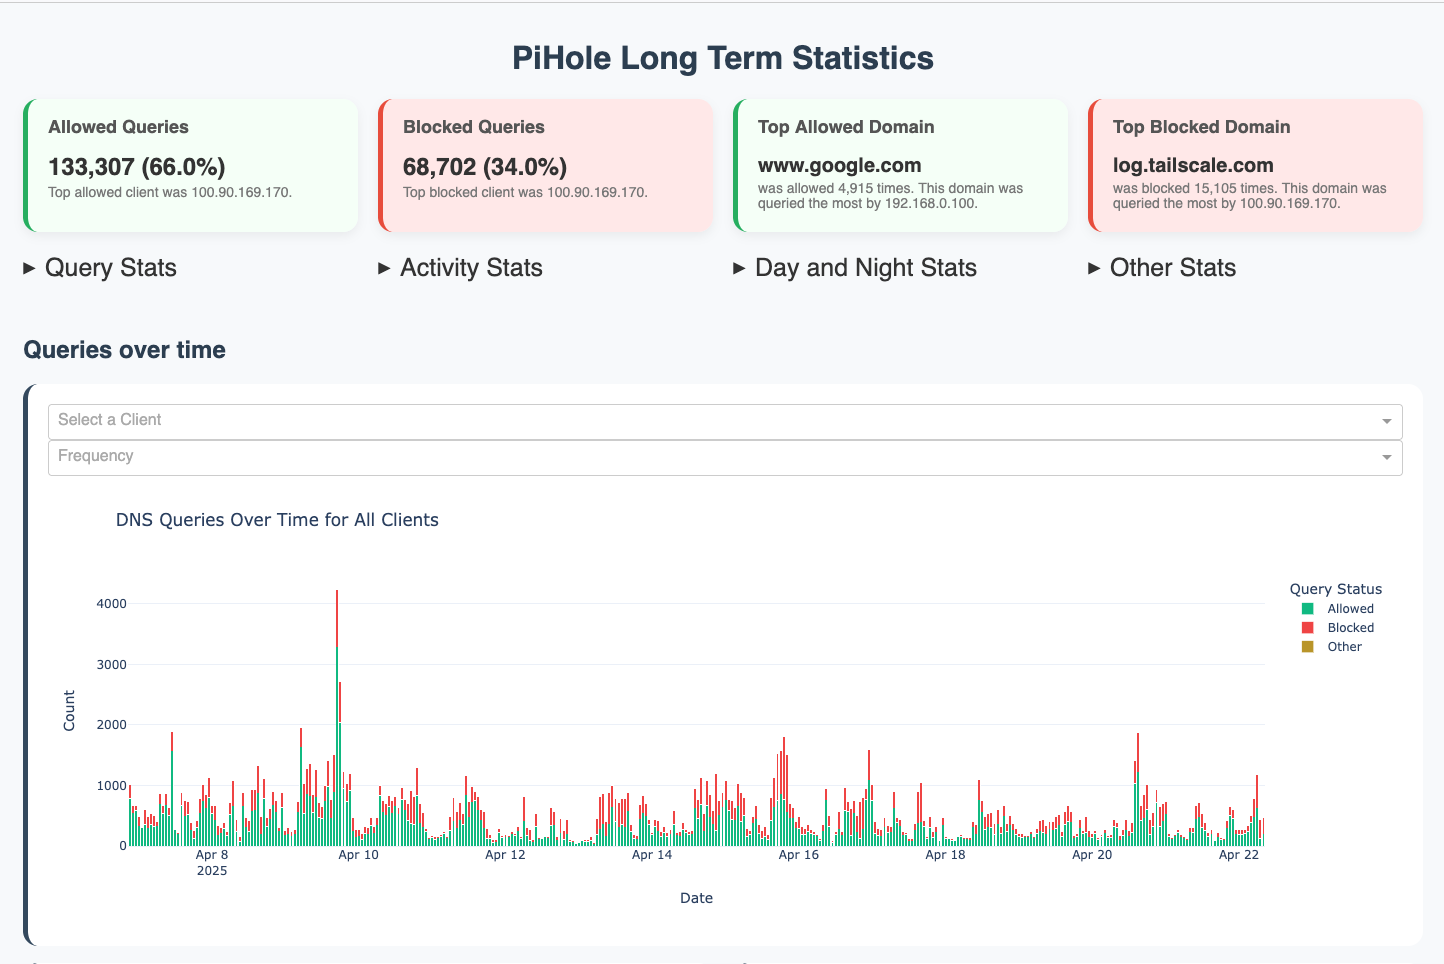
As a personal project, I made a dashboard for visualizing long term statistics with data from the FTL database.
Link to the GitHub repo : GitHub - davistdaniel/PiHoleLongTermStats: A dashboard to visualize DNS query data from a Pi-hole v.6 FTL database file.
I would like to see the long term graphs in v6 too!
I'd also like to see this re-added.
Here's a practical example. I was wondering why the block rate dropped from around 50% to 25%. With the long term data, it would have been easy to understand. But now I had to figure it out using the API. By the way: I replaced Windows 10 with Linux Mint on an old PC ![]()
I absolutely miss this. I use the graphs to find anomalies.
This would be very usefyl
I can not update to v6, if there is no long-term data!
The long-term data menu was the greatest feature for me and main reason for the use of Pi-hole. It is the best feature to find network issues in our work group.
After the first test installation of v6, I thought I've done something wrong or don't understand the new menu. It's hard to find out that there is not long-time graphics.
There is long-term access in form of a unified Query Log where you can request data way into the past. You Pi-hole will automatically substitute from the database where necessary. But yes, no graphs.
But why no graphs?
This is - in my opinion - one of the best Pi-hole features. Is it so difficult to use the same type of graphics as in v5?
First of all, thanks for developing pi-hole, it is awesome.
Second and less important, the long term graphs in v5 were awesome, I would like them back if that's doable.
Have a nice day!
Well, kind of. The API has been rewritten from scratch to be much more modern and follow current web standards. One would have to sit down and (re)implement the necessary code. I don't see this right now with anyone from the core team but, hey, Pi-hole is 100% open-source and any external contribution will be carefully checked, discussed and, if it works as expected, merged so you can immediately benefit from such changes on the next release (or even earlier if you test development versions).