Nice idea, but
- Pi-hole system is running on a super fast internal M.2 NVMe for a few months only
- the issue got 100 % introduced with the Pi-hole software update - so no reason to blame the hardware (but I understand you thought in that direction).
Nice idea, but
Well… at least we now know that it should not be a problem then! ![]()
However please do keep in mind that even the best SSD out there can have issues from time to time because of some unforseen firmware bug for example…
Yeah, now that we ticked the IT basics for beginners (very interesting for IT technicians working in IT for 20 years ![]() ) we can finally stop talking about hardware and focusing on the root cause for this bug: the software update introducing this. The silence of the Pi-Hole team is impressive.
) we can finally stop talking about hardware and focusing on the root cause for this bug: the software update introducing this. The silence of the Pi-Hole team is impressive.
I can't reproduce your observation in my Pi-hole:
I don't see loading times of 5 seconds for my Query Log, but I can see the query table being rendered empty very briefly before it gets populated (but then my query database is under 100M in size).
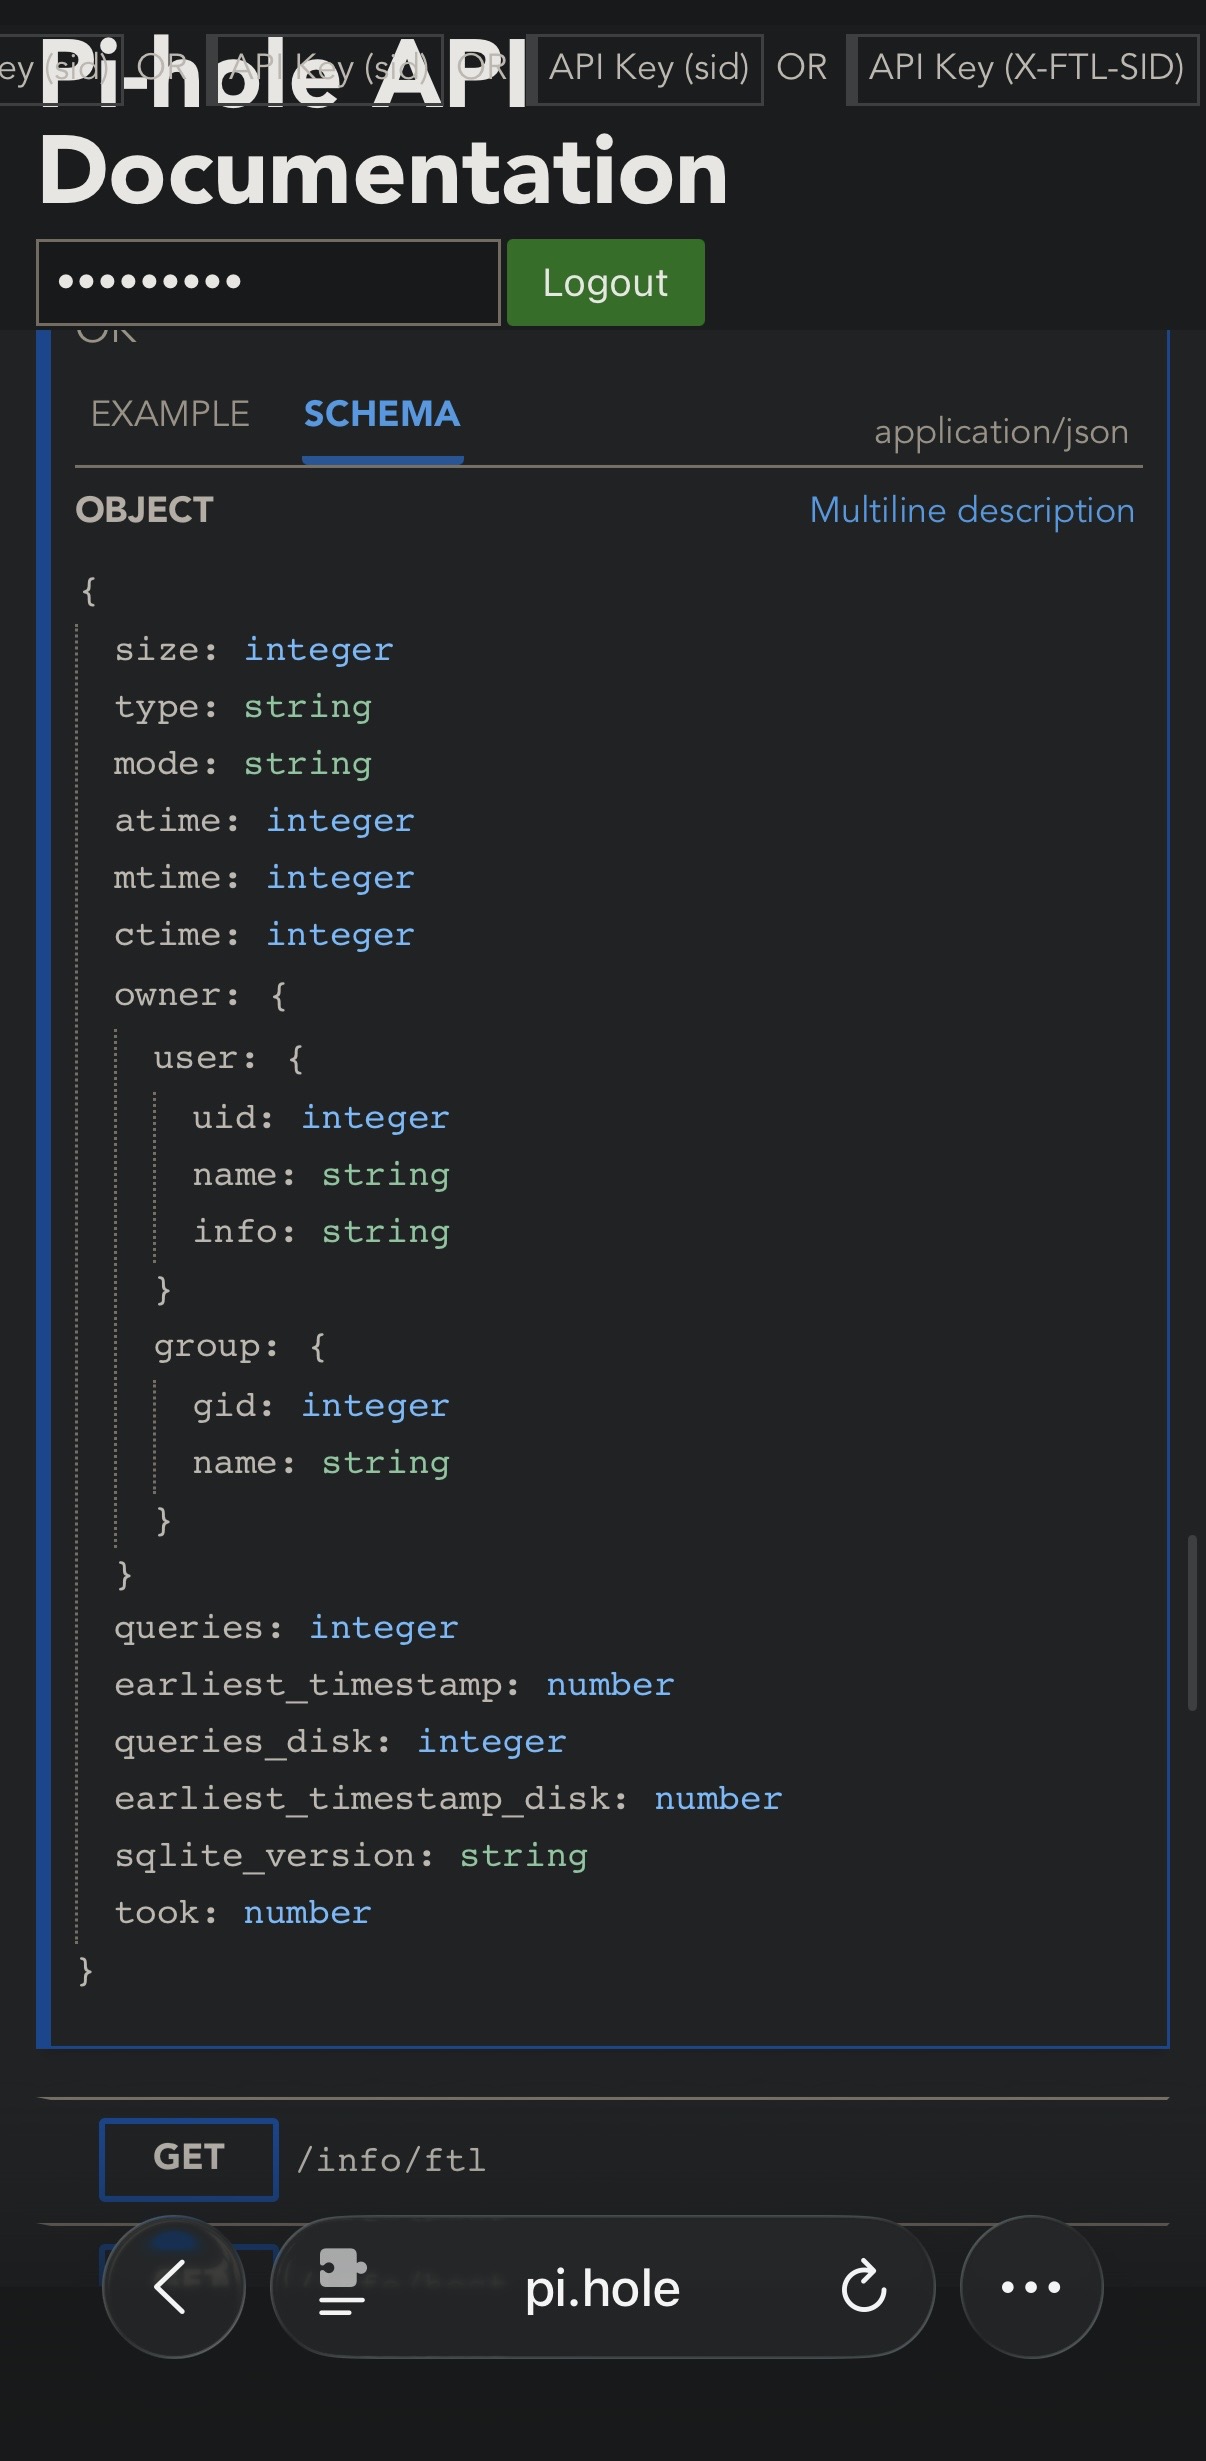
Nevertheless, I compared my current Pi-hole against an older Docker version, and the current version shows an extra field:
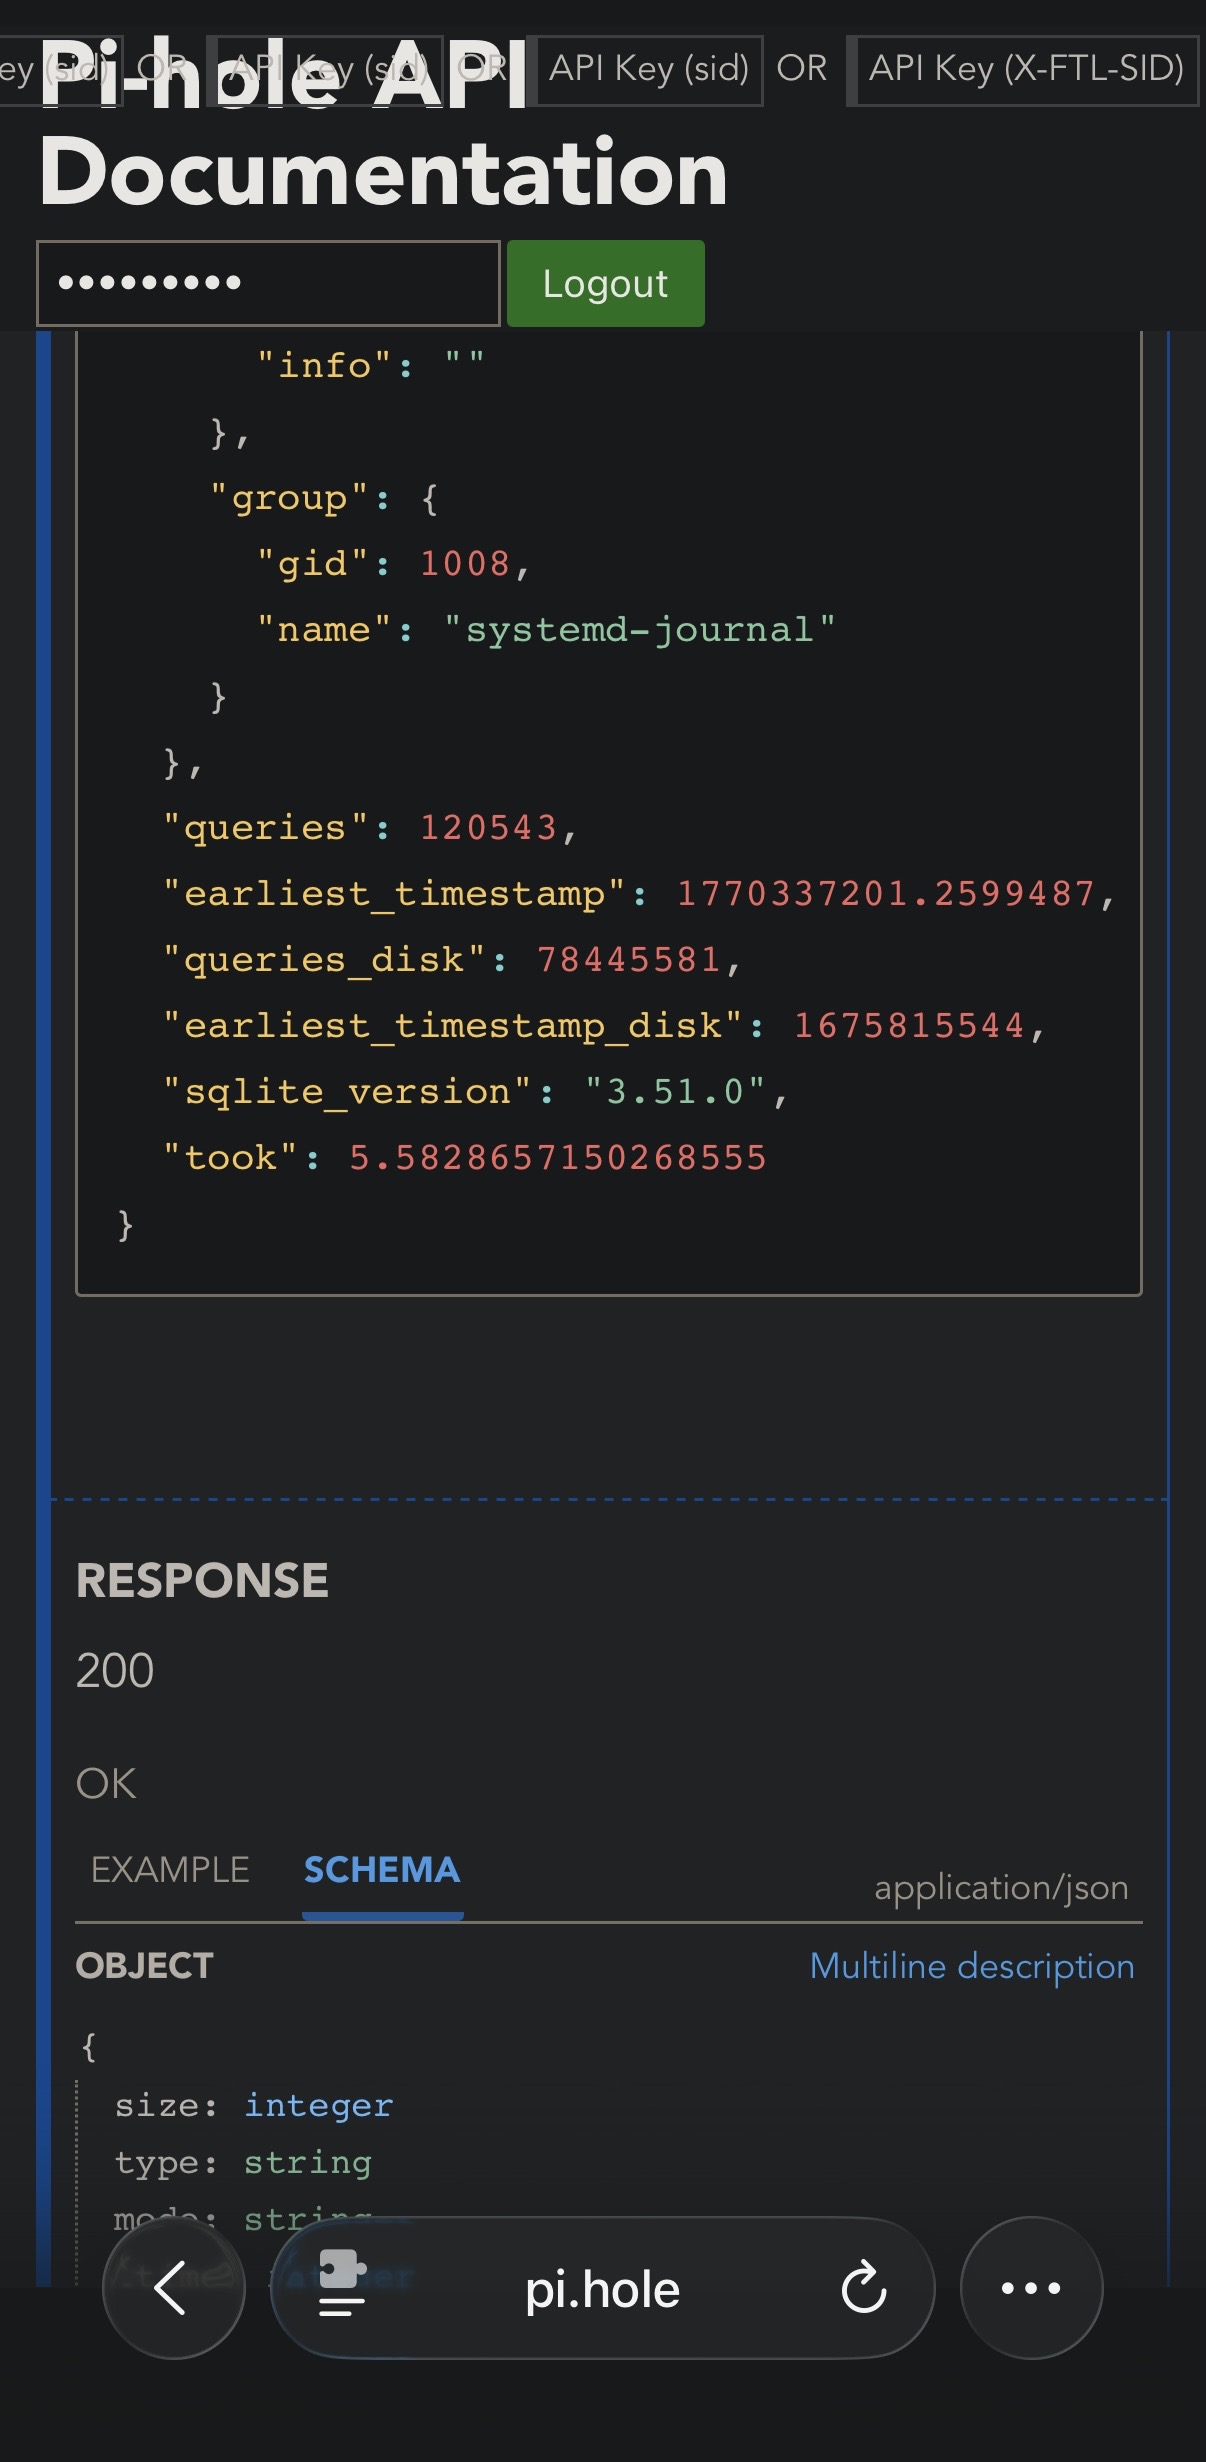
As can be glanced from scripts/js/queries.js, this Earliest date is populated by an info/database API call.
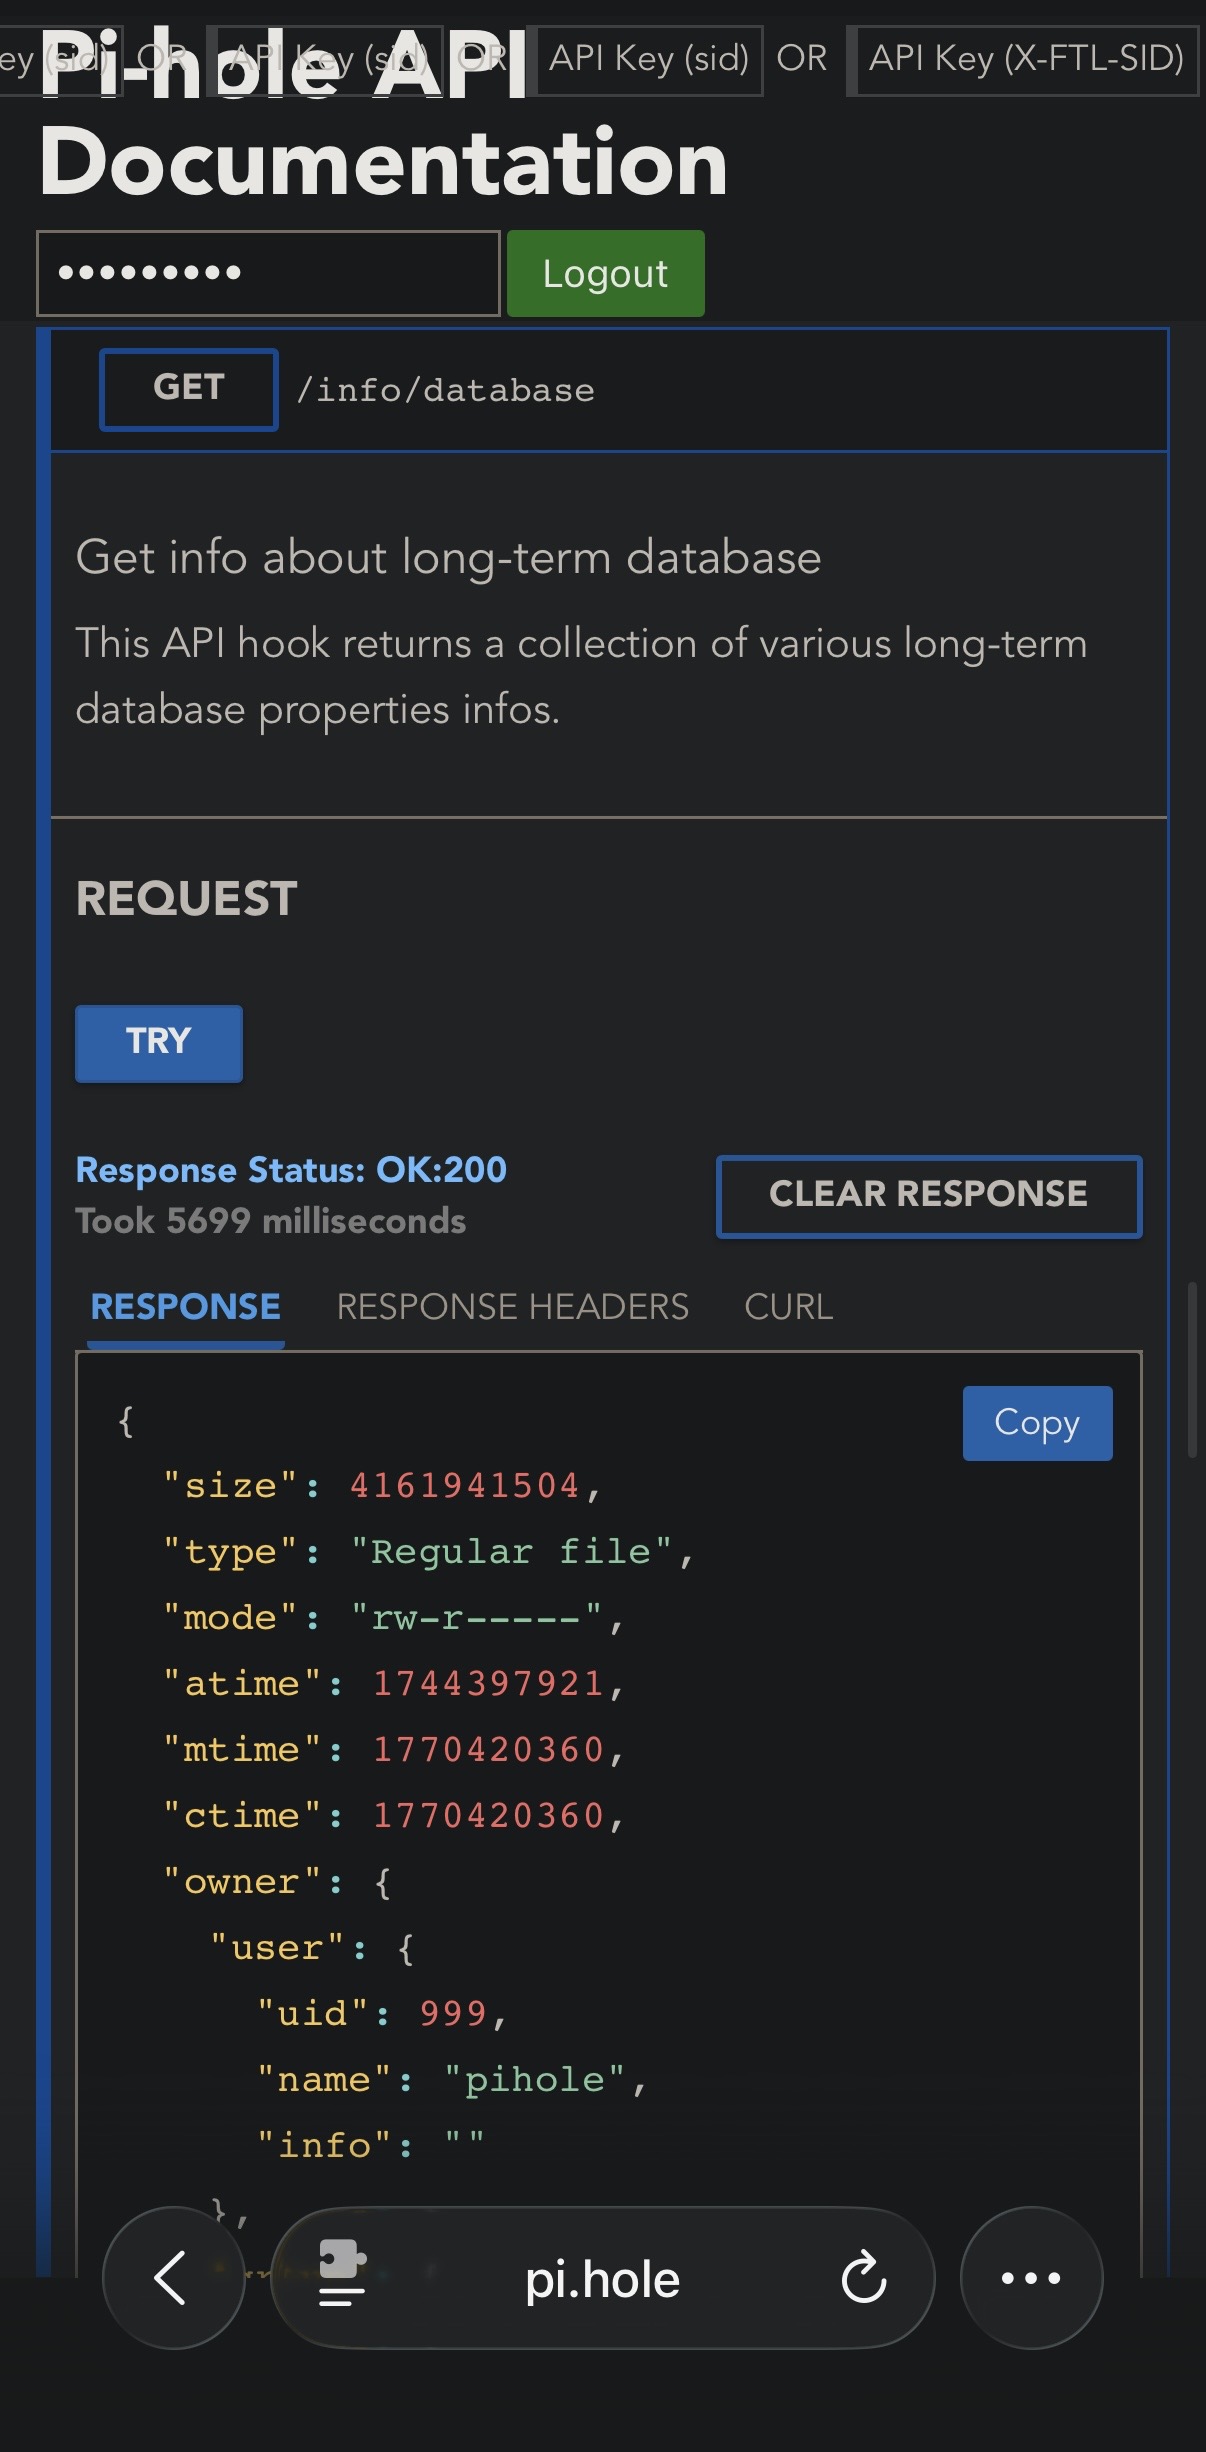
So I started Pi-hole's API documentation and compared http://pi.hole/api/docs/#get-/info/database response times, and I can see a
notable difference of ~30ms with FTL 6.2.3 to ~550ms with FTL 6.4.1.
That said, those numbers are not directly comparable, since those calls were run on different hardware, and the Docker instance has a very small database.
Still, I think the difference is significant, and this is likely due to computing the earliest date, which would force a full scan of the query table's timestamp field.
Could you please share a screenshot of an info/database API call on your Pi-hole?
To exclude API initialisation effects, you should perhaps run it (via http://pi.hole/api/docs) several times before taking that.
If response times for an info/database API call on your system would match your observed delays, I'd think we found the culprit.
If so, earliest_timestamp probably could be stored in the database FTL table, with less precision (e.g. as a date instead of a timestamp), and updated once per day, to avoid having to compute that field on every API request. Alternatively, it could be updated during regular database pruning, when entries exceeding the database retention threshold are cleared.
Another approach to deal with increased cost of calling info/database would be to cache the reply values in the web UI session, so it would only be incurred once per session.
Actually close to 35 years here, but you did not mention it so I had to ask Mr. Smartass ![]()
Just for reference, storage medium shouldn’t have any effect in this case. We’re specifically excluding queries against the on-disk data (“Query on-disk data” option is not checked"), so all data access should be happening within memory only.
You misspelled 'intentional'.
Hey @Bucking_Horn
Did what you suggested, and you can see from the screenshot that it’s taking close to 4000ms for a response. Ran it several times and all of the runs were comparable in a 3700 - 4000ms range. Doesn’t exactly match my observed query log delay (I’m manually timing it at just under 7s), but hope this helps.
Wow, the Pi-Hole guru trolling around. Somehow I expected you got more important things to do.
Back to business:
@Bucking_Horn your observations are outstanding, thank you so much for having such a close look into this. We finally shed some lights on this, underlining with API facts what we described in our experience. I think technically you nailed the root cause with the earliest date field.
My result - while on the go unfortunately not a single screenshot (also the various runs differ only a few hundred ms in terms of response times):
We actually have an improvement for this (and a few other related things) still awaiting review. It is exactly doing this (eliminating COUNT(*) and MIN(timestamp) at all) this, see
Thank you, that's good news, and it has just been merged into the development branch, too.
I can confirm that response times for info/database calls are down to ~25 to ~30 ms with the current nightly Docker build.
Looking forward to see that in an upcoming stable release.
Especially as I discovered this, one central question is if this resource usage is related to this issue:
While I can confirm updating to latest release containing the mentioned fix
Core version is v6.4 (Latest: v6.4)
Web version is v6.4.1 (Latest: v6.4.1)
FTL version is v6.5 (Latest: v6.5)
the query log at https://pi.hole/admin/queries finally loads lightning fast (instant) again, I'm not sure about (will need to monitor this for a while) the
But that is another topic. The original issue of this issue is solved now. Thanks.
This topic was automatically closed 21 days after the last reply. New replies are no longer allowed.