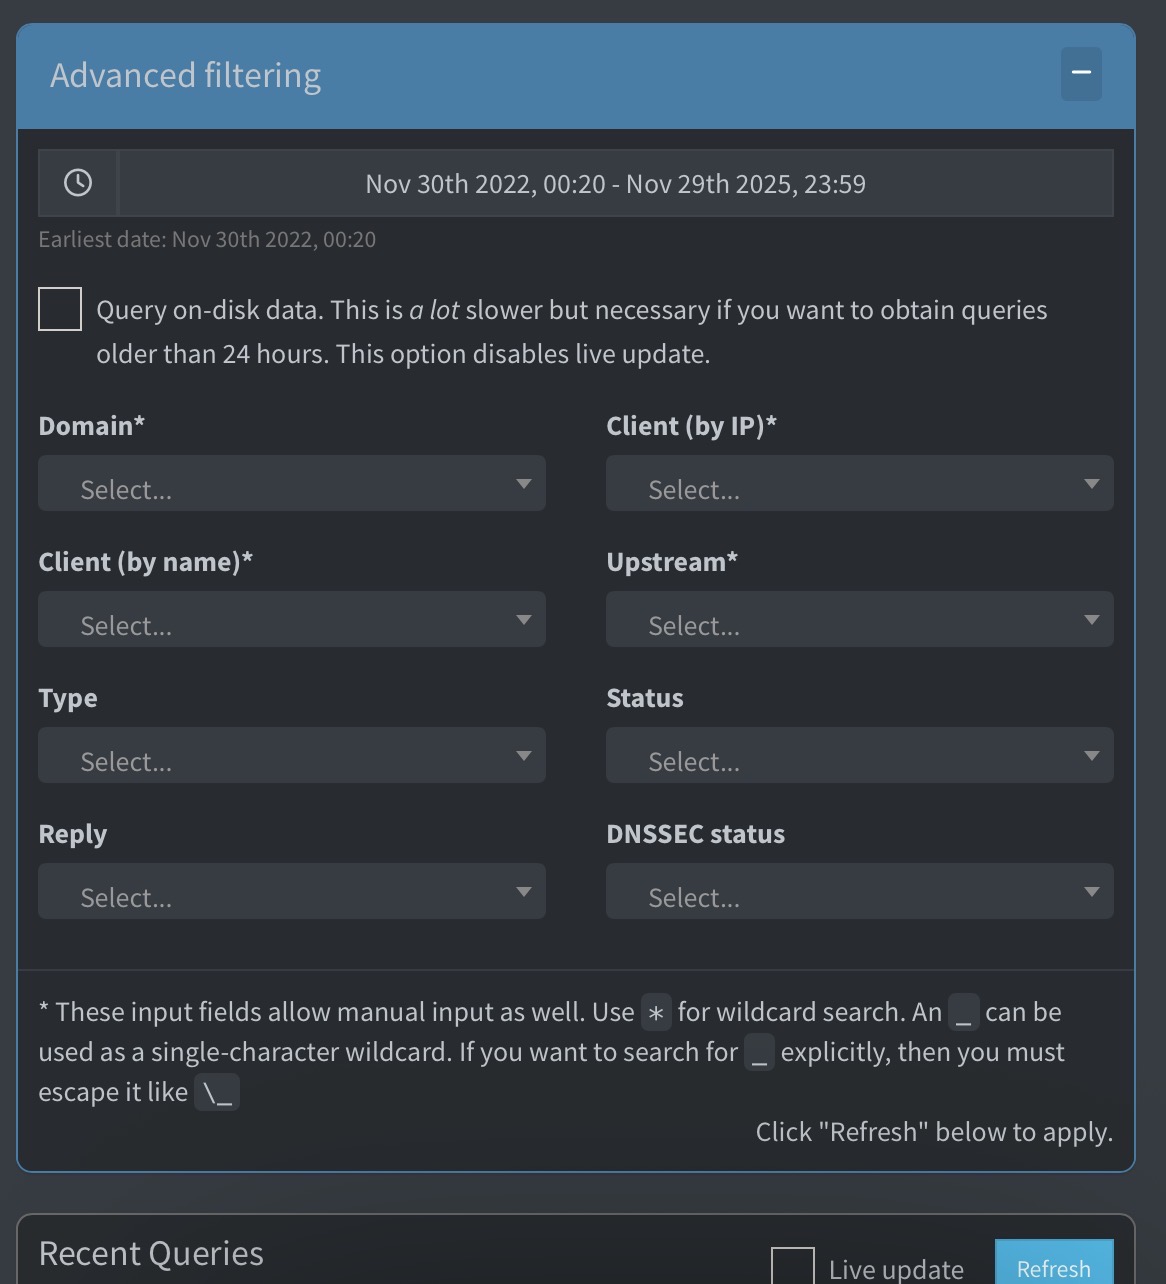
When checking the filter above I notice the „all time“ is set as default, explaining why the page load takes so much time. This behavior has definitely changed. How to set the default filter to e. g. „Today“?
Before the latest release, the initial value was set to 2020-01-01, as you can see on this Github issue, but this is only applied when you select the "Query on-disk data" checkbox.
With out the checkbox, only data from the last 24h is loaded.
Technically yes. But unless you have changed the debug process in the last two years I will have to manually check for privacy related information first. Was way too chatty for my taste back in July 2023. So I will follow up once finished.
6 seconds loading time at minimum. No matter if accessed via http oder https.
sudo service pihole-FTL stop
sudo cp /etc/pihole/pihole-FTL.db /etc/pihole/pihole-FTL_BU.db
sudo sqlite3 /etc/pihole/pihole-FTL_BU.db "PRAGMA integrity_check;"
-> ok
sudo service pihole-FTL start
sudo pihole status
[✓] FTL is listening on port 53
  [✓] UDP (IPv4)
  [✓] TCP (IPv4)
  [✓] UDP (IPv6)
  [✓] TCP (IPv6)

[✓] Pi-hole blocking is enabled
Ah I see pihole -d is also performing an integrity check so this was not necessary in addition.
*** [ DIAGNOSING ]: Pi-hole FTL Query Database
-rw-r----- 1 pihole pihole 3,7G 14. Dez 18:53 /etc/pihole/pihole-FTL.db
[i] Checking integrity of /etc/pihole/pihole-FTL.db ... (this can take several minutes)
\ 01:03
So here’s the redacted pihole debug:
First upload (potentially failed- /usr/local/bin/pihole: Zeile 38: /etc/pihole/versions: Keine Berechtigung - as pihole almost everywhere needs a sudo since v6): https://tricorder.pi-hole.net/fCJVoQFK/ .
@jfb pardon me for direct pinging - I was wondering if the debug log was helpful. I don’t know what’s your debug log retention time so I wanted to make sure it is not missed.
Somehow the calculation seems to take so much longer than before this change (where no calculation took place at all, right?), rendering two CPUs with FTL on 100 % for 4 to 5 seconds and resulting in overall page load time of at least 6 seconds.
That with even only data of last 24 hours is shown, which is fine. I put my bets on the calculation, not the data fetching. Browser network analysis showed waiting for server response, not a browser/client issue, just for the records. On my system, the pihole-FTL.db is around 3.8 GB with over 76 million entries. Previously, loading the Query Log was very fast, even with the same database size.
Reworking that change would be great. A small tweak like this could make a huge difference for users with large historical logs.
Following because I’m experiencing the same issue. Takes about 10s for my query log to load in the web GUI. Query on-disk data is off.
I stopped the pihole service, removed my pihole-FTL.db since it was up to 4.6GB, and restarted the service, and the query log was near instant. However, just 24h later, it was back to taking about 10s to load. pihole-FTL.db file is up to 50MB.
Running on a raspberry pi 4 B w/ 4GB of RAM, running Raspberry Pi OS v12.12
That’s interesting, as it indicates it’s not necessarily a DB size indicated issue.
Unfortunately there was no response for two weeks now and I try to avoid directly pinging core team members - maybe they are simply on holiday.
As mentioned in my previous posts, I suspect that the named change is the cause for this. As it’s 6 seconds loading time for my Pi 5 compared to the 10 seconds on a Pi 4 it’s very likely a computational thing (Pi 4 a bit less powerful).
At this moment the ball lies in the field of the Pi-Hole team - all Information including debug logs have been provided.
As a test, I created a new raspberry pi OS install on a new pi 4B w/ 2GB RAM, and installed only pi-hole on it. Updated my DHCP settings to point to the new instance and transferred settings over from my old instance using Teleporter.
After less than 24h, the Query Log is taking over 5s to load in the web UI. Thought it might have been a conflict with also having Tailscale installed on the raspberry pi, but with this new instance having the same issue with only pi-hole installed, it’s obviously not that.
This is black box testing. Might be helpful, but without a dev/expert finally taking the investigation lead (they got the debug logs… in case they did not get removed already meanwhile, not sure bout the retention policy) we won’t make any noteworthy progress here.
Great solution oriented proposal. This helps build trust, more of this spirit
(when you finally get an expert response and you realize it’s not that helpful as you were hoping for (a long time) and you see it even is THE number one expert - priceless. Happy new year everybody )