FTL causing increasingly high CPU load/CPU Pinning

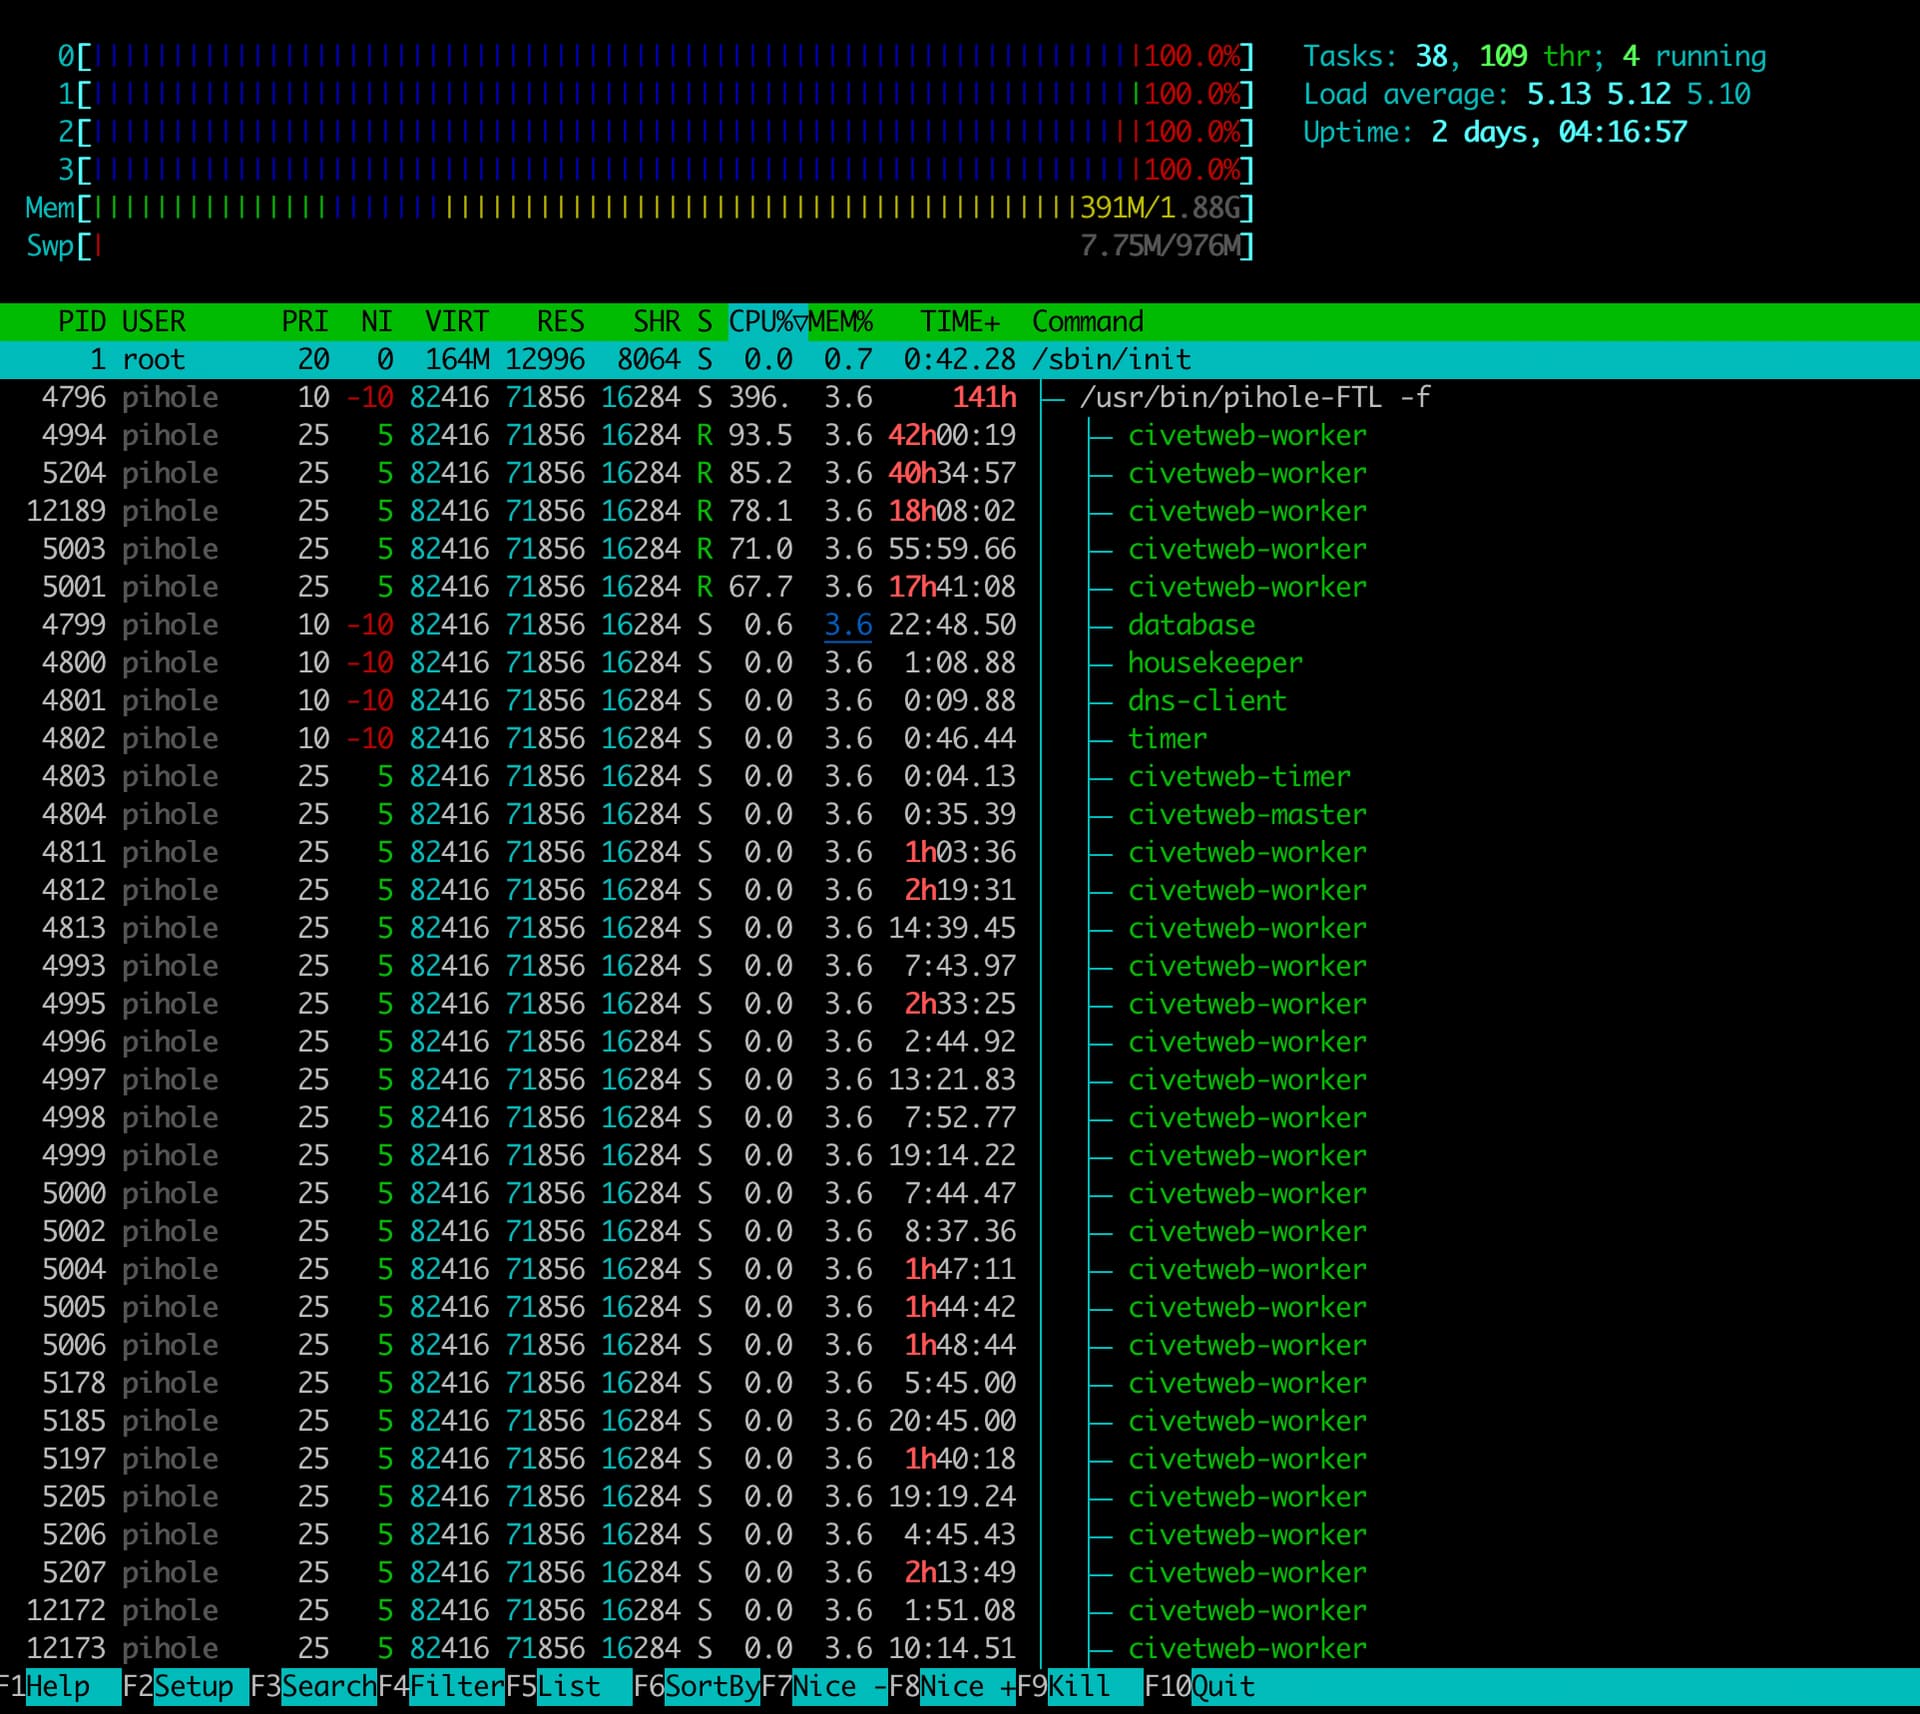
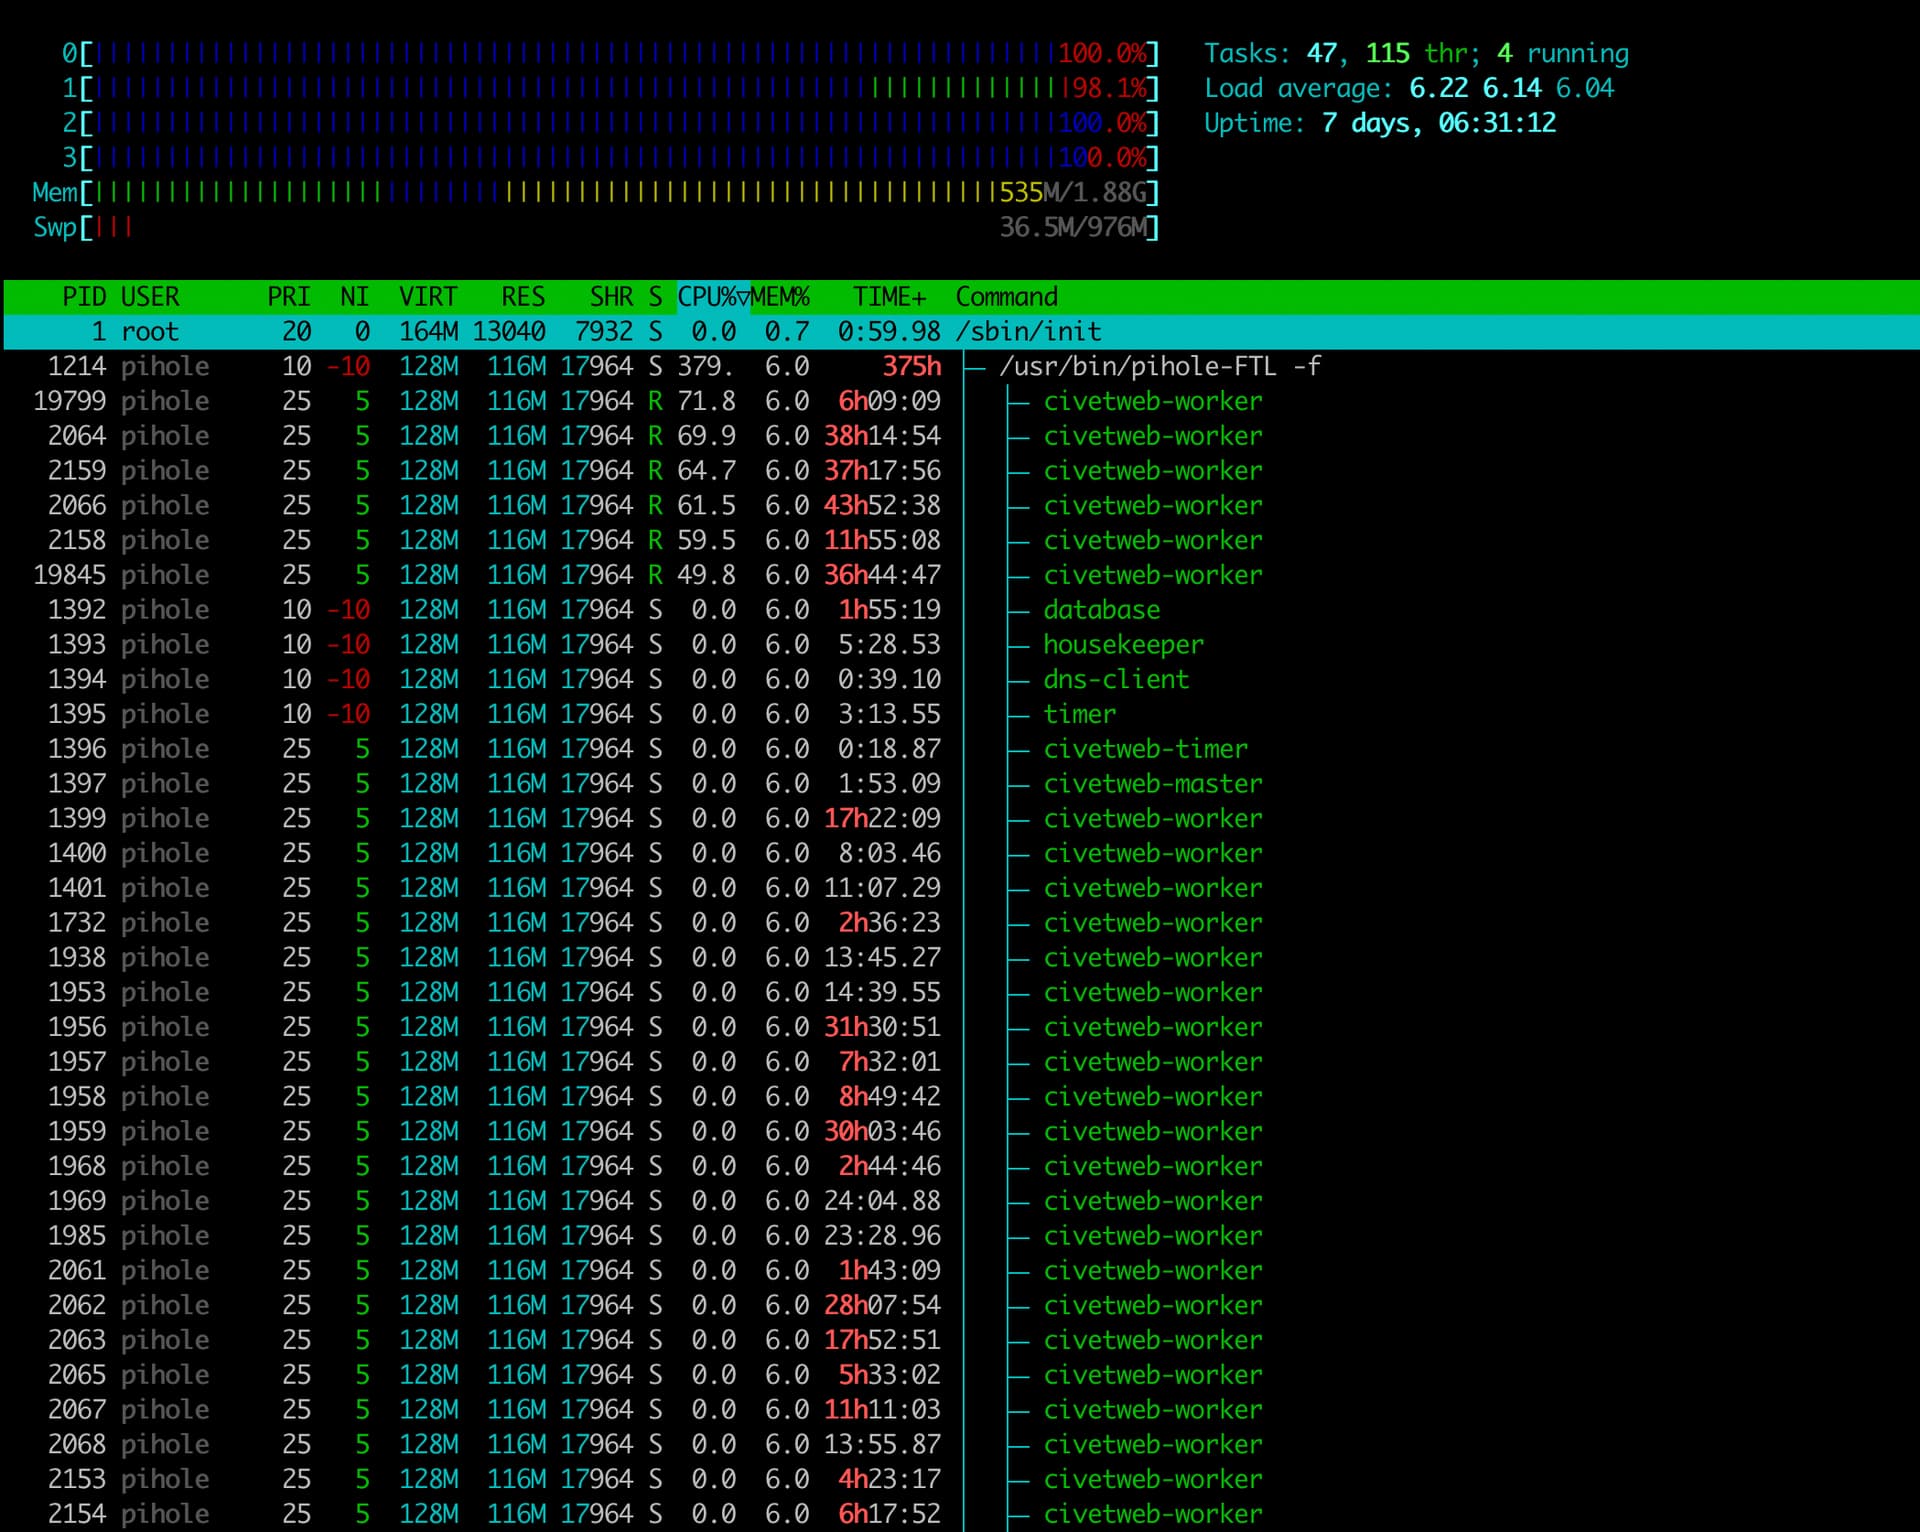
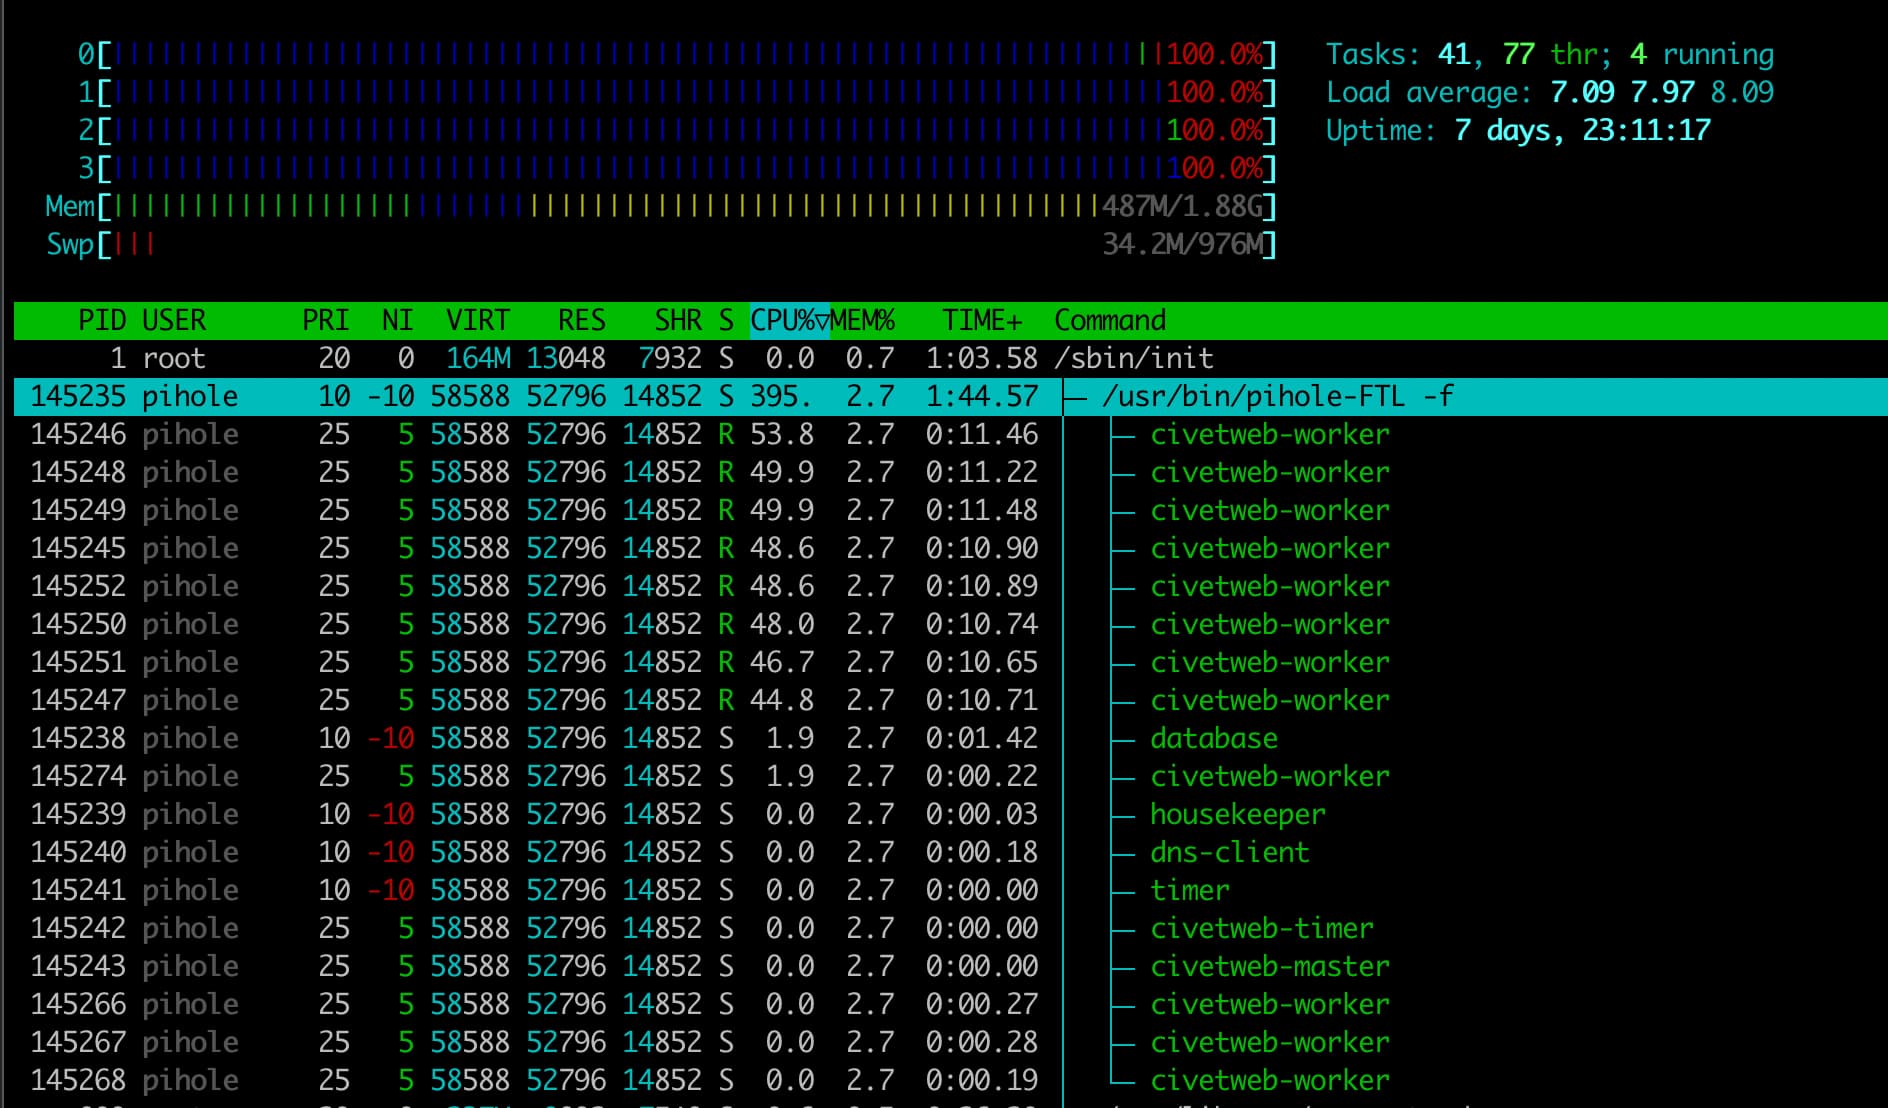
Over the last few days, I have noticed that FTL is causing my CPU to pin at 99% usage.

This is a dedicated pihole server that Ive been running for 8 years now, the only other thing running that is non pihole related is glances for monitoring.

No recent system changes other than “latest” updates to HomeAssistant integration and Pi-Stats iOS app

  • Ubuntu 22.04.5 LTS (kernel 5.15.0-151-generic)
  • Hardware:
    • Intel(R) Atom(TM) CPU N2600 @ 1.60GHz
    • 2GB RAM
    • 30GB SSD

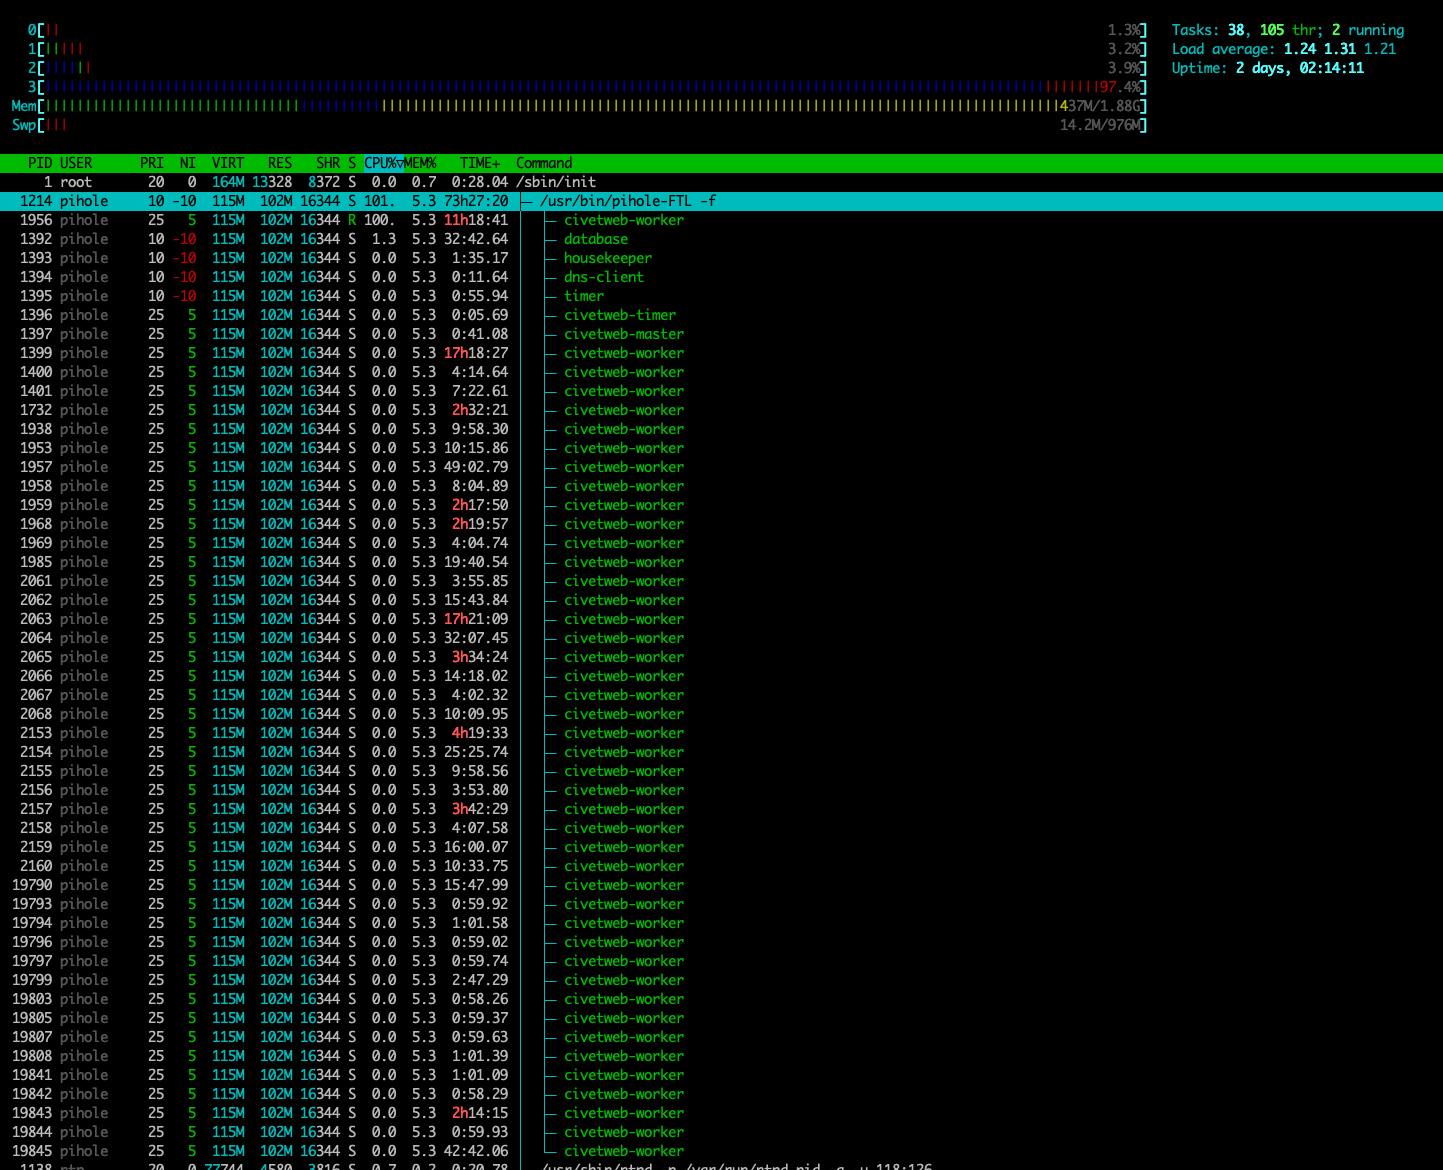
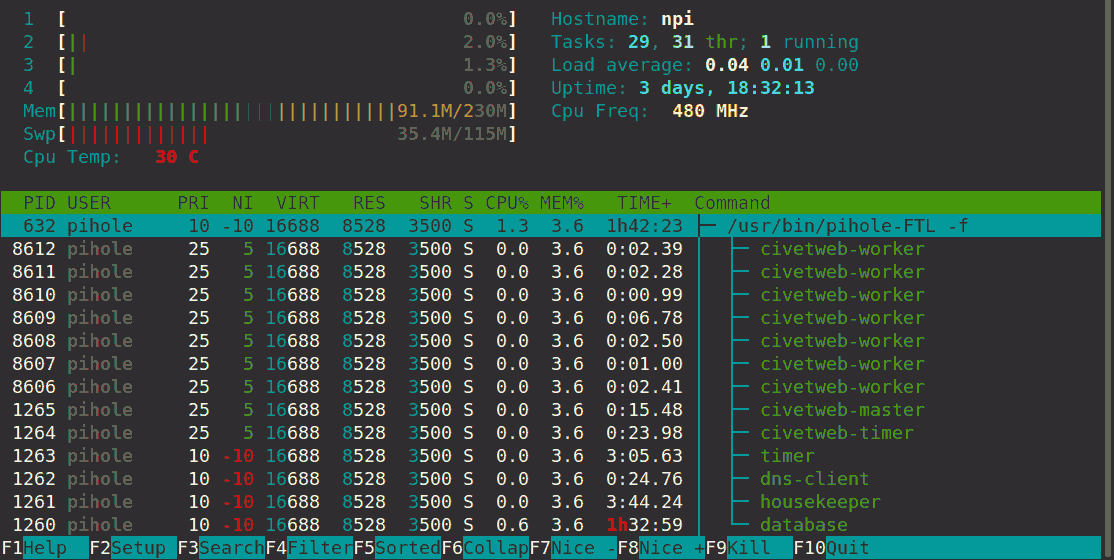
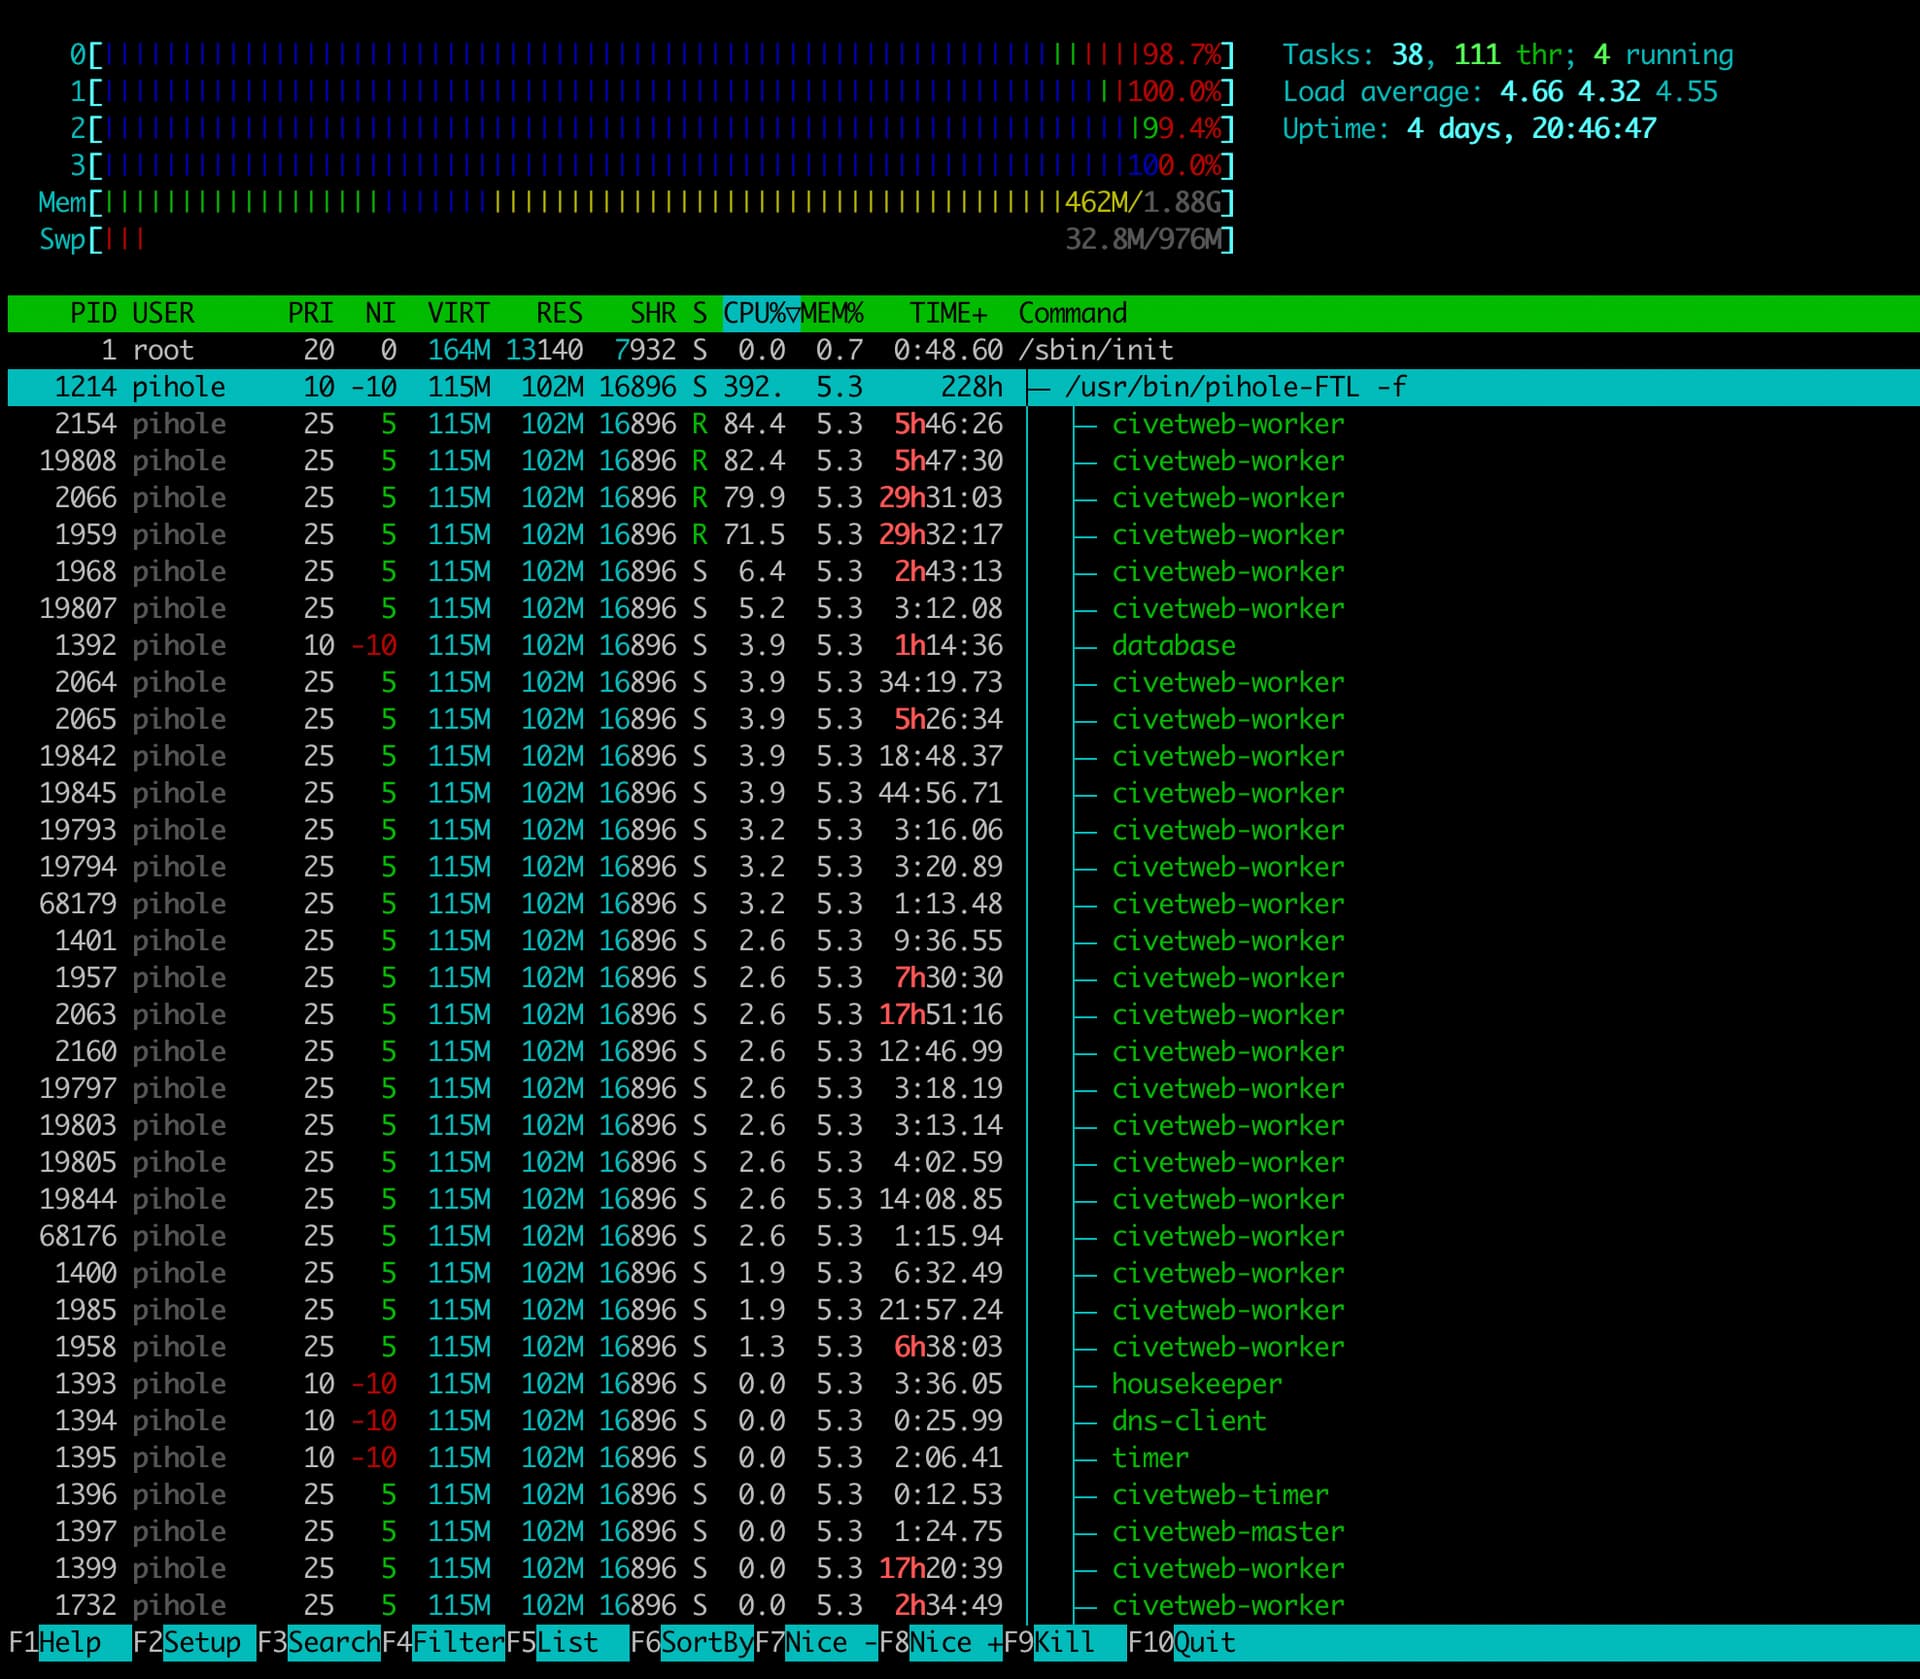
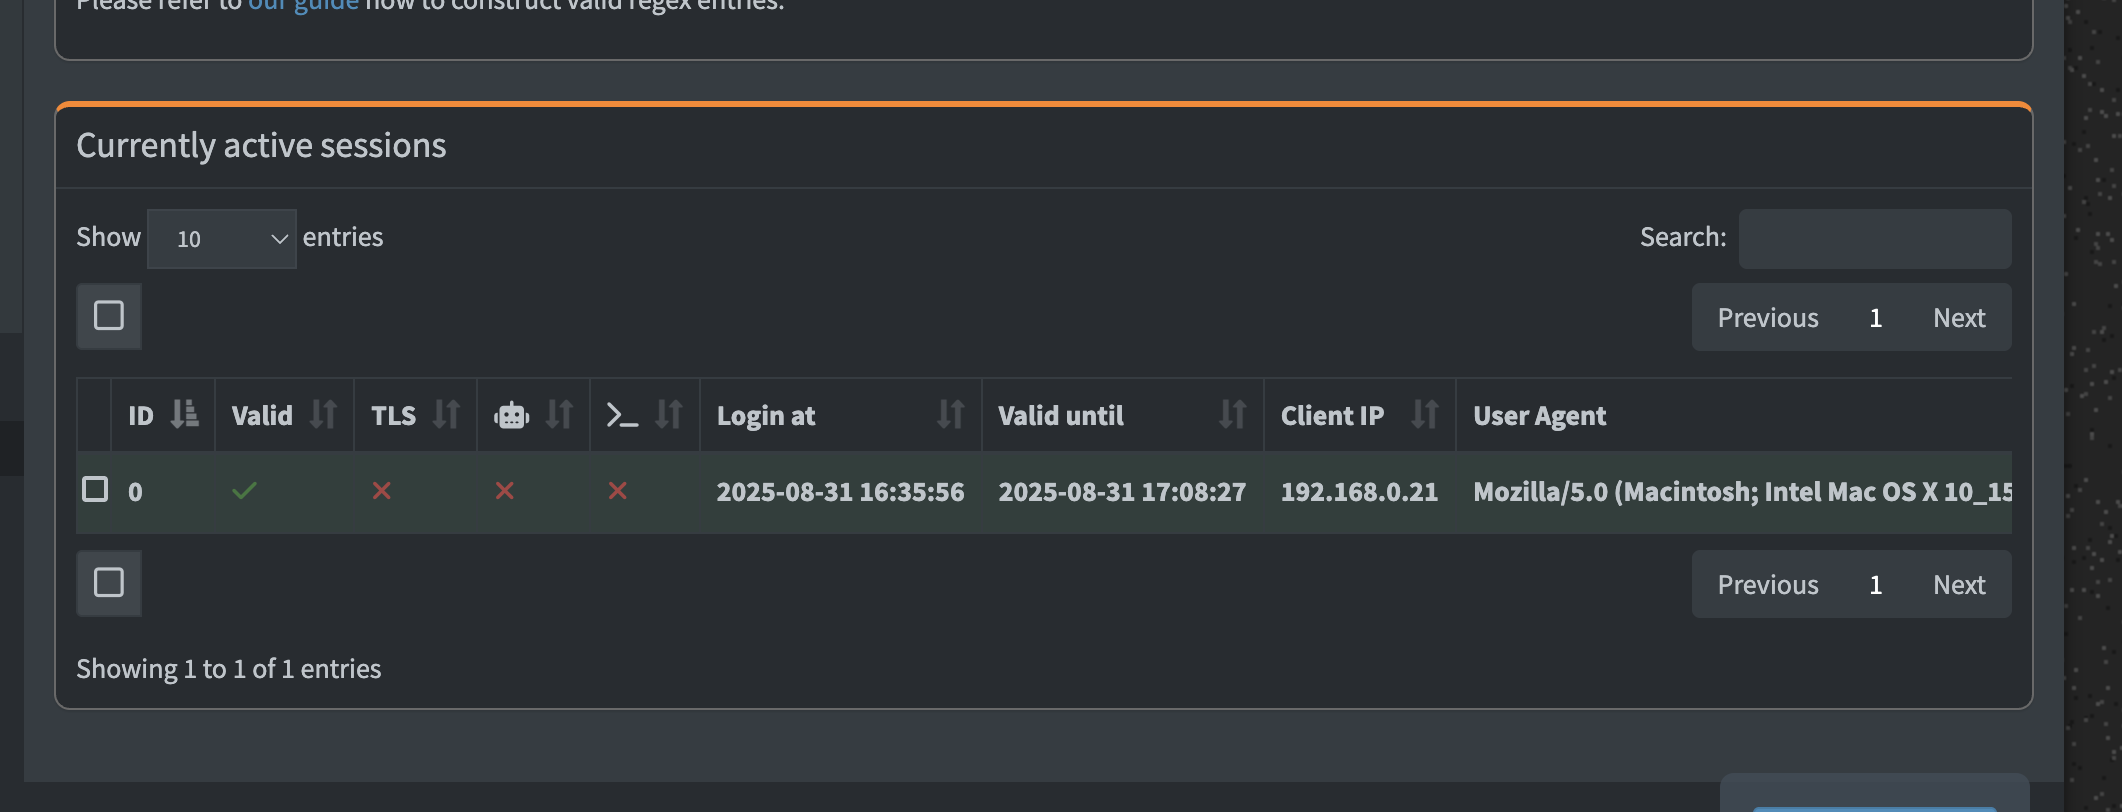
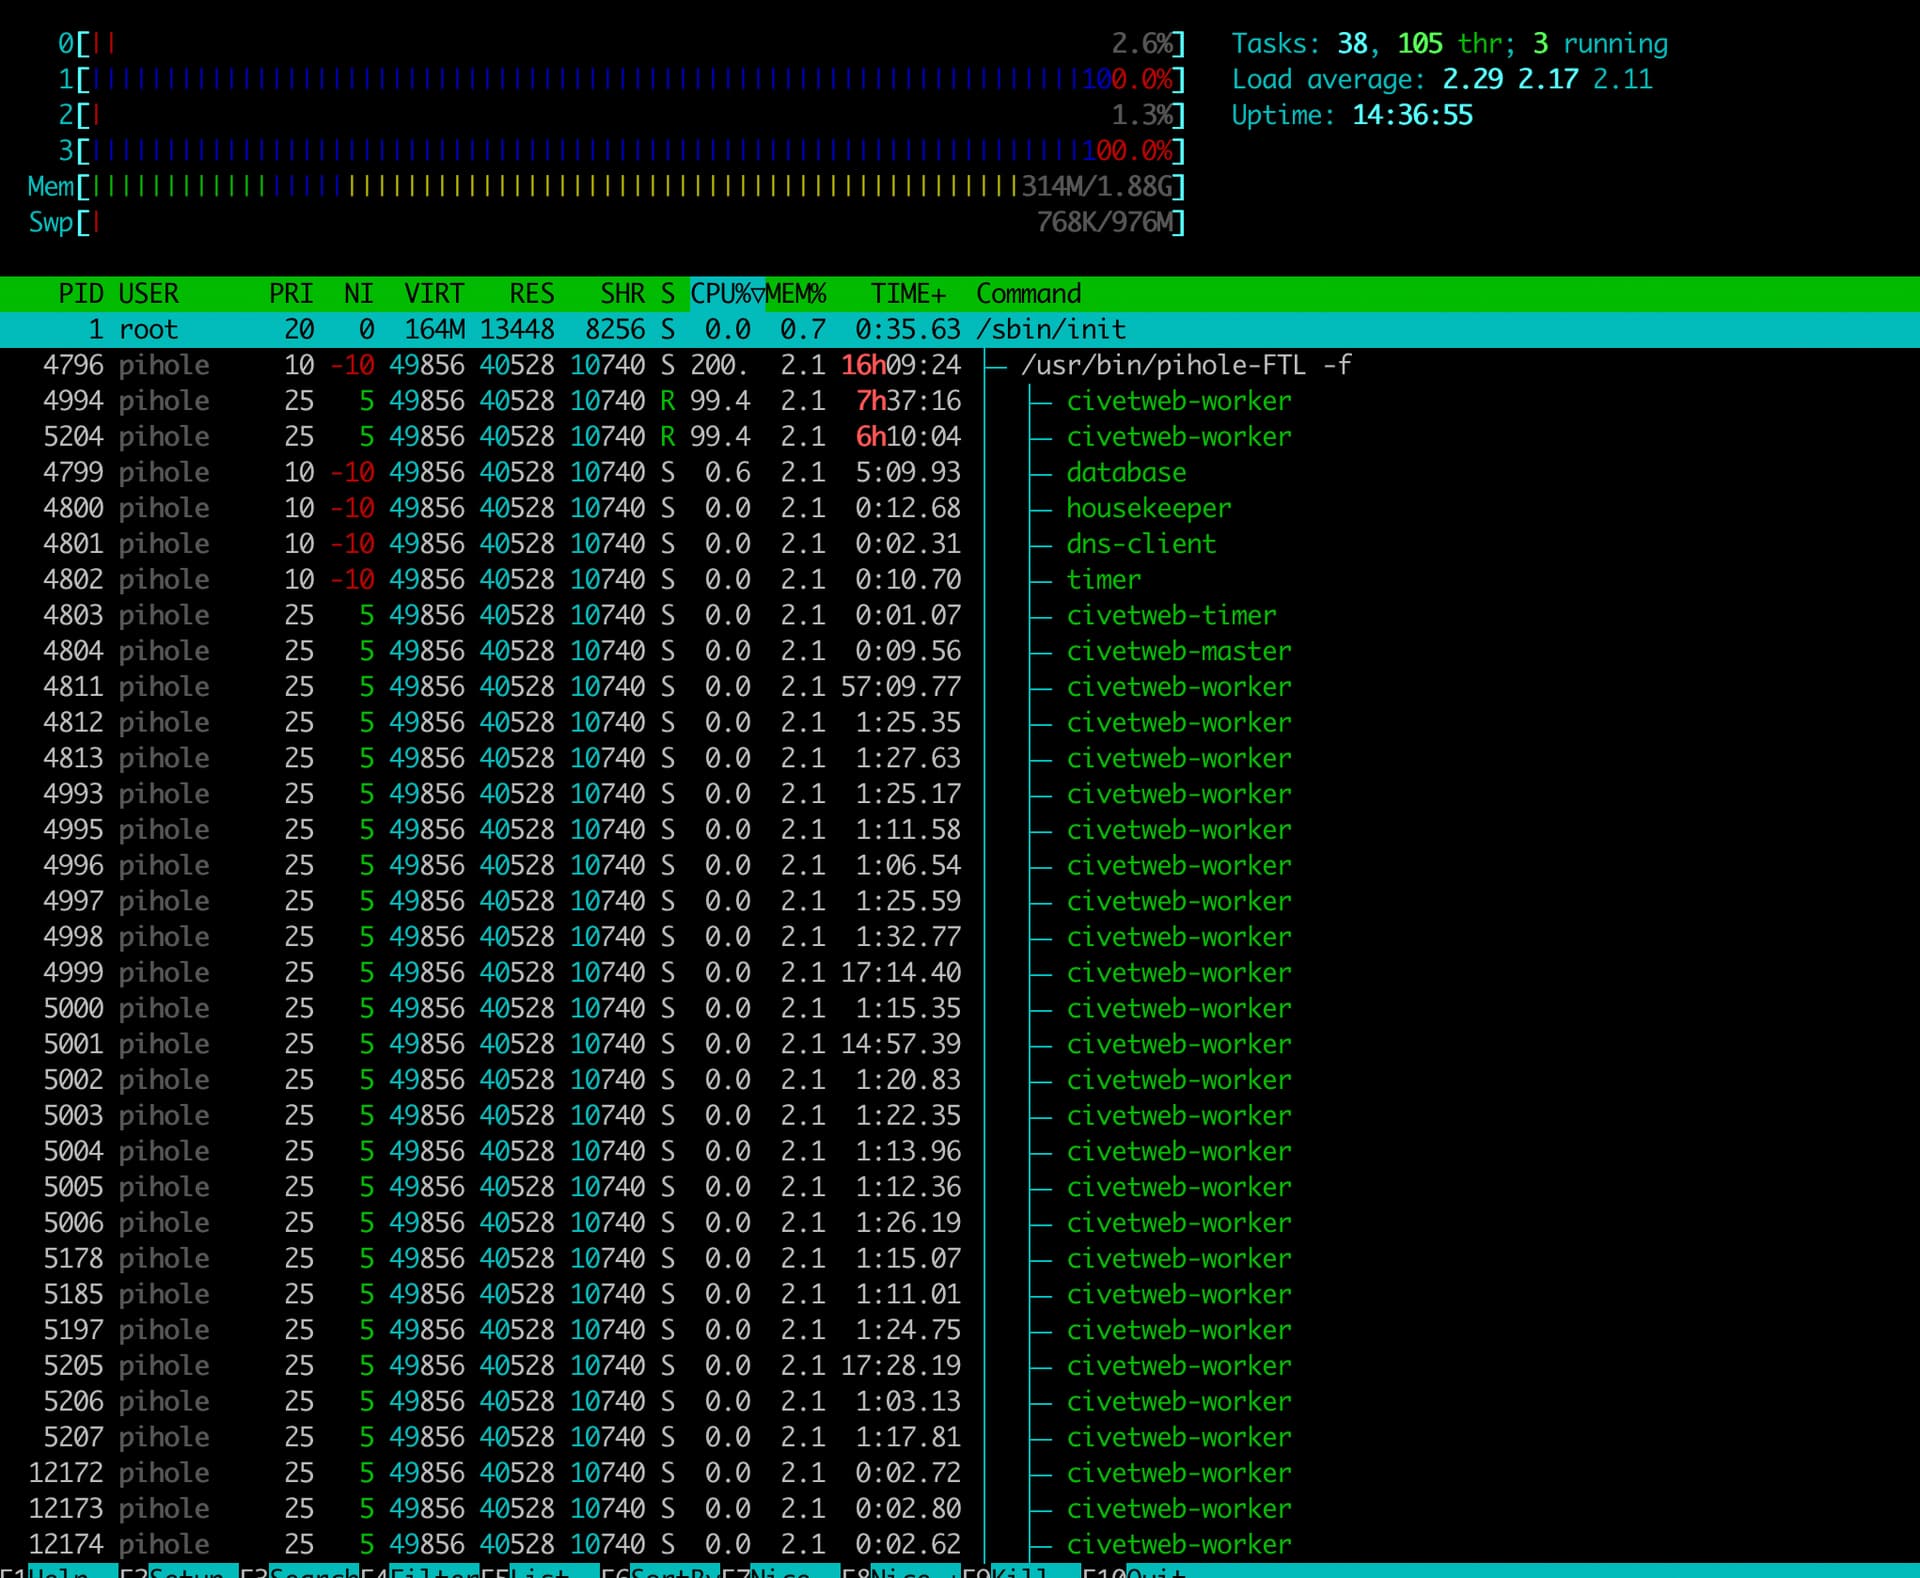
Last night (+/- 10 hours ago) I attempted this step which seemed to help and reduced CPU usage to 2% but this morning the CPU is already at 50% and climbing

I’ve found this Github issue which may be related, but doesnt seem like anything is happening with it Higher demands on resources · Issue #2599 · pi-hole/FTL · GitHub

Debug Token:

https://tricorder.pi-hole.net/pa5EBVwY/

Anyone?

Current htop

I have this problem. Suddenly FTL starts loading the processor by 100 percent. This can happen for several hours in a row. Nothing suspicious was found. The previous version worked correctly for a year.

Out of interest what is your setup? Upgrade from v5 to v6 or fresh install of v6? HomeAssistant? Native or containers? What CPU model?

@poiromaniax, your htop shows quite a few Pi-hole webserver threads, some few of which significantly contributing to CPU load.
Do you run third-party software that interacts with Pi-hole's UI and/or API?

@Icewind, how does htop look for your Pi-hole machine (tree view with custom thread names)?

Yes, HomeAssistant and PiStats iOS app (wrote in my main post :slight_smile: )

Ill try disable them one by one and see if it makes a difference

Been almost 2 days since disabling the HomeAssistant integration, htop seems better so far

The numbers are a bit lower, but they are still far from what I'd expect.
For comparison, pihole-FTL has only consumed 1.75 hours during the last 3.75 days, with its database thread contributing ~90% towards that, and only 7 civetworker threads in total:

In contrast, your Pi-hole still consumes 73.5 hours during 2 days, which are mainly caused by civetworker threads, with only ten of those already accounting for several hours of CPU each, while the database only rates at just over half an hour.

Would your load decrease to expected levels once you stop using both HomeAssistant and PiStats?

If this would be related to your third-party tools, it would suggest that those tools are requesting Pi-hole's API excessively often, and the high total count of civetworker threads may also indicate that they may be requesting a new session upon each request, probably never releasing the previous one, which will keep resources bound longer than necessary.

Dont think its either of these addons now. The HomeAssistant integration has been disabled for close to a week and I havent used the iOS app in longer than that too….

This is htop from right now

Pi-hole would busy a civetworker thread only on HTTP/API requests.

Since HomeAssistant and PiStats are contributing to your observation, but you still have high counts and CPU of civetworker threads when disabling those two, that would suggest yet another source.

Please share your Pi-hole's Currently active sessions under Settings | Web Interface / API.

Would the Client IPs from that list match those of devices that you expect to use your Pi-hole's API?

Theres just my admin session open (and the CPU dropped down again to 10%)

It seems to strongly spike and then reduce

Is there any other debug anything I can provide/monitor?

Puzzling - that would almost seem like normal behaviour.
Have HomeAssistant and PiStats been disabled during that inspection?
Did the count of civetworker threads decrease as well?

Session credentials may be reused with API requests, even if they'd come from separate IPs.

You could try to get a hold of IPs by inspecting Pi-hole's logs.

Please close any Pi-hole UI windows you may have open in browsers, and don't open any new ones during investigation, to avoid UI requests from polluting your observations.
For the same reason, you should also keep your HomeAssistant and PiStats deactivated.

Run from a shell on your Pi-hole machine, start monitoring your FTL.log for API requests:

sudo tail -f /var/log/pihole/FTL.log | grep Requested

From another(!) shell, enable API debugging for your Pi-hole:

sudo pihole-FTL --config debug.api true

Monitor the output from your first shell, which would have lines similar to:

2025-08-31 11:56:54.890 CEST [53/T173] DEBUG_API: Requested API URI: 192.168.1.29 -> GET /api/stats/summary ? (null) (Content-Type (null))

What IP addresses do show up there, and what devices would they belong to?
What API requests are they sending?

Considering sharing some of those lines that you find suspicious.

If you don't see any traffic, consider activating exclusively either HomeAssistant or PiStats, to get an idea of the amount of requests they issue, and whether they'd correctly terminate sessions after usage.

When done, don't forget to disable API debugging:

sudo pihole-FTL --config debug.api false

Thanks for the instructions

So yes, neither HomeAssistant or PiStats have been active over the last few days at all. The CPU is still “consistently” doing this 100% spike dance. I do notice a reduction in civetworker when the load drops, and of course increase when spiking

This is a current htop

I tail’ed the log with debug enabled (as per your instructions) at this time, there are 0 entries returned

Bummer - zero HTTP/API requests would indicate that those >17 excessively busy civetworker threads have been started well before you've initiated your debug.api session. As we don't know what API requests have been starting them, we can't easily find out what they are occupied with.

Obviously, they have failed to terminate, perhaps because their associated session has not been properly released, or due to some other cause yet to be discovered.

Restarting your pihole-FTL should get rid of them.

sudo systemctl stop pihole-FTL 
sudo systemctl start pihole-FTL

Then repeat the debug.api steps and monitor request activity, starting by first activating and using HomeAssistant.

I restarted FTL, had htop open while doing so. Of course when the service was stopped and all the workers killed, the CPU dropped to minimal usage (<20%)

I started FTL again and immediately back to 100% usage (Before Ive done anything):

Out of interested, I enabled debug logging and tailed the log file, then used sudo service pihole-FTL restart with htop open to try again.

Now FTL usage is as expected (still no log entries though :slight_smile: )

I have enabled HomeAssistant addon, I see the requests coming from it:

ariel@pihole:~$ sudo tail -f /var/log/pihole/FTL.log | grep Requested
2025-09-03 11:26:42.996 IDT [145745/T146131] DEBUG_API: Requested API URI: 192.168.0.245 -> POST /api/auth ? (null) (Content-Type application/json)
2025-09-03 11:26:45.197 IDT [145745/T146131] DEBUG_API: Requested API URI: 192.168.0.245 -> GET /api/stats/summary ? (null) (Content-Type application/json)
2025-09-03 11:26:45.210 IDT [145745/T146131] DEBUG_API: Requested API URI: 192.168.0.245 -> GET /api/auth ? (null) (Content-Type application/json)
2025-09-03 11:26:45.259 IDT [145745/T146131] DEBUG_API: Requested API URI: 192.168.0.245 -> GET /api/padd ? full=true (Content-Type application/json)
2025-09-03 11:26:45.287 IDT [145745/T146131] DEBUG_API: Requested API URI: 192.168.0.245 -> GET /api/auth ? (null) (Content-Type application/json)
2025-09-03 11:26:45.335 IDT [145745/T146131] DEBUG_API: Requested API URI: 192.168.0.245 -> GET /api/info/messages/count ? (null) (Content-Type application/json)
2025-09-03 11:26:45.392 IDT [145745/T146131] DEBUG_API: Requested API URI: 192.168.0.245 -> GET /api/auth ? (null) (Content-Type application/json)
2025-09-03 11:26:45.443 IDT [145745/T146131] DEBUG_API: Requested API URI: 192.168.0.245 -> GET /api/clients ? (null) (Content-Type application/json)
2025-09-03 11:26:45.502 IDT [145745/T146131] DEBUG_API: Requested API URI: 192.168.0.245 -> GET /api/auth ? (null) (Content-Type application/json)
2025-09-03 11:26:45.549 IDT [145745/T146131] DEBUG_API: Requested API URI: 192.168.0.245 -> GET /api/auth/sessions ? (null) (Content-Type application/json)
2025-09-03 11:26:45.596 IDT [145745/T146131] DEBUG_API: Requested API URI: 192.168.0.245 -> GET /api/auth ? (null) (Content-Type application/json)
2025-09-03 11:26:45.643 IDT [145745/T146131] DEBUG_API: Requested API URI: 192.168.0.245 -> GET /api/dns/blocking ? (null) (Content-Type application/json)
2025-09-03 11:26:45.690 IDT [145745/T146131] DEBUG_API: Requested API URI: 192.168.0.245 -> GET /api/auth ? (null) (Content-Type application/json)
2025-09-03 11:26:45.740 IDT [145745/T146131] DEBUG_API: Requested API URI: 192.168.0.245 -> GET /api/groups ? (null) (Content-Type application/json)
2025-09-03 11:26:45.792 IDT [145745/T146131] DEBUG_API: Requested API URI: 192.168.0.245 -> GET /api/auth ? (null) (Content-Type application/json)
2025-09-03 11:26:45.843 IDT [145745/T146131] DEBUG_API: Requested API URI: 192.168.0.245 -> GET /api/info/messages ? (null) (Content-Type application/json)
2025-09-03 11:26:45.858 IDT [145745/T146131] DEBUG_API: Requested API URI: 192.168.0.245 -> GET /api/auth ? (null) (Content-Type application/json)
2025-09-03 11:26:45.907 IDT [145745/T146131] DEBUG_API: Requested API URI: 192.168.0.245 -> DELETE /api/auth ? (null) (Content-Type application/json)
2025-09-03 11:31:45.993 IDT [145745/T146131] DEBUG_API: Requested API URI: 192.168.0.245 -> POST /api/auth ? (null) (Content-Type application/json)
2025-09-03 11:31:48.221 IDT [145745/T146131] DEBUG_API: Requested API URI: 192.168.0.245 -> GET /api/stats/summary ? (null) (Content-Type application/json)
2025-09-03 11:31:48.233 IDT [145745/T146131] DEBUG_API: Requested API URI: 192.168.0.245 -> GET /api/auth ? (null) (Content-Type application/json)
2025-09-03 11:31:48.281 IDT [145745/T146131] DEBUG_API: Requested API URI: 192.168.0.245 -> GET /api/padd ? full=true (Content-Type application/json)
2025-09-03 11:31:48.310 IDT [145745/T146131] DEBUG_API: Requested API URI: 192.168.0.245 -> GET /api/auth ? (null) (Content-Type application/json)
2025-09-03 11:31:48.358 IDT [145745/T146131] DEBUG_API: Requested API URI: 192.168.0.245 -> GET /api/info/messages/count ? (null) (Content-Type application/json)
2025-09-03 11:31:48.415 IDT [145745/T146131] DEBUG_API: Requested API URI: 192.168.0.245 -> GET /api/auth ? (null) (Content-Type application/json)
2025-09-03 11:31:48.466 IDT [145745/T146131] DEBUG_API: Requested API URI: 192.168.0.245 -> GET /api/clients ? (null) (Content-Type application/json)
2025-09-03 11:31:48.524 IDT [145745/T146131] DEBUG_API: Requested API URI: 192.168.0.245 -> GET /api/auth ? (null) (Content-Type application/json)
2025-09-03 11:31:48.578 IDT [145745/T146131] DEBUG_API: Requested API URI: 192.168.0.245 -> GET /api/auth/sessions ? (null) (Content-Type application/json)
2025-09-03 11:31:48.629 IDT [145745/T146131] DEBUG_API: Requested API URI: 192.168.0.245 -> GET /api/auth ? (null) (Content-Type application/json)
2025-09-03 11:31:48.680 IDT [145745/T146131] DEBUG_API: Requested API URI: 192.168.0.245 -> GET /api/dns/blocking ? (null) (Content-Type application/json)
2025-09-03 11:31:48.729 IDT [145745/T146131] DEBUG_API: Requested API URI: 192.168.0.245 -> GET /api/auth ? (null) (Content-Type application/json)
2025-09-03 11:31:48.780 IDT [145745/T146131] DEBUG_API: Requested API URI: 192.168.0.245 -> GET /api/groups ? (null) (Content-Type application/json)
2025-09-03 11:31:48.832 IDT [145745/T146131] DEBUG_API: Requested API URI: 192.168.0.245 -> GET /api/auth ? (null) (Content-Type application/json)
2025-09-03 11:31:48.882 IDT [145745/T146131] DEBUG_API: Requested API URI: 192.168.0.245 -> GET /api/info/messages ? (null) (Content-Type application/json)
2025-09-03 11:31:48.898 IDT [145745/T146131] DEBUG_API: Requested API URI: 192.168.0.245 -> GET /api/auth ? (null) (Content-Type application/json)
2025-09-03 11:31:48.946 IDT [145745/T146131] DEBUG_API: Requested API URI: 192.168.0.245 -> DELETE /api/auth ? (null) (Content-Type application/json)

Seems to be pretty normal? I also see what I assume is the session termination at the end with the DELETE method?

FTL usage in htop during this is about 1.5%

This topic was automatically closed 21 days after the last reply. New replies are no longer allowed.