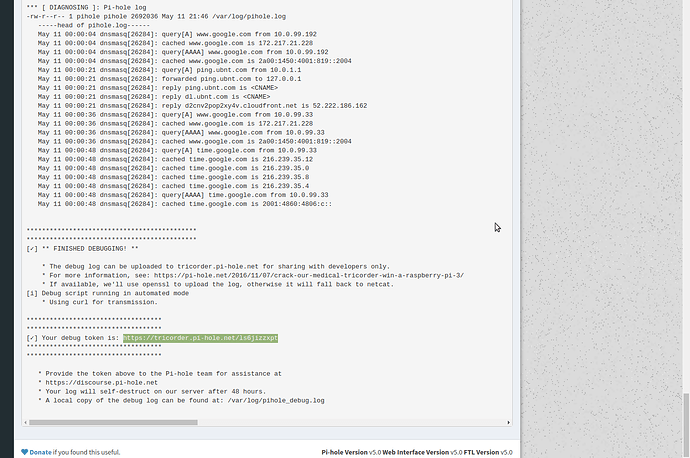
Generating the debug token via Web GUI is a useful feature. However the debug token is hard to find for unexperienced users - one has to scroll down the whole debug log and the token is not visual distinguished from the rest of the text.
The two rows of ***** on either side aren't sufficient?
As I and someone else independently came up with the feeling that the token might be hard to find: no.
It's not high priority but something that could be improved.
I most definitely think this is a usability issue. I know I'll come off as an idiot but I kept waiting for the token to appear. To have to then scroll down and try to find it is a bit cumbersome as well.
The token is generated AFTER the log is uploaded. It's done server side. If you run the debug on the console then the token is displayed after you say "yes". The web interface is an live scroll of the console output. There is no way to display the token before the debugging process starts.
The debug process shouldn't be run so often that you have to keep waiting for the token to appear.
As you explained the wait time and and server-side generation of the token is of technical nature and (at least for me) not part of this request. It takes as long as it takes to process all the debug.
For me it's only the visibility of the token at the end of the output. Maybe you could grep it and display it with a popup in the GUI after it is displayed by the script in the console output?
How often do you have a developer asking you for a token?
The interface is php, feel free to add any features you'd like to see. Promo already explained that this is not a simple process, it's not going to be something any of the developers work on.
See a minimal-effort try here:
And completely eliminates the need to even try to read the debug log and fix things for yourself.
I'm voting no, our support team is already overloaded as it is without adding in more people that just post a token and say "Fix it for me."
My opinion - the debug token is easily found on a log, at the end of the log where it should be. A user should at least have a basic understanding of what they upload to us - just popping up a debug token at the top takes the user completely out of the loop.
I have probably asked for or read a few thousand debug logs in the past 18 months. I don't recall users asking "where is the debug token".
However, given that the web interface does not scroll to the bottom (as does the terminal output), a note at the top that says "scroll to bottom of the log to read the clearly identified debug token" would be useful.
Autoscroll is something that can be added. It's already done in the tail log page.
Consistency between the two methods of generating a debug log would be good. Autoscroll would work nicely.
I don't think autoscroll would work. At least, not with the debug log in it's current state. The log is not revealed to the page as it is generated, rather it pops out after it is generated.
Having an autoscroll would just immediately scroll the log to the bottom of the page as soon as it has finished processing is going to be the same net effect as @DL6ER's proposal above.
Personally I think that if we're going to do anything, we just put an info box at the top with a brief blurb along the lines of (but not necessarily )
The debug log can help point out issues with your install that you might not otherwise be aware of. Please check through it, as it may contain information that answers your question before you've even asked it. If, after checking through the log you are still unsure of the issue, you can find a token at the end of the output (provided you have chosen to upload the log) that you can share with the Pi-hole support team.
^ But better written
TL;DR - as well as being a tool to help us help users, it is ideally supposed to also help them help themselves.
This is a good solution as well, but perhaps with modified text. TBD.
I'll go by what the people providing the support and the people who will handle the brunt of this want to see.
These are all very good arguments. I will close my PR.
Yes, this is too bad. It worked when I added it (a long time ago), however, all major browsers changed their interpretation of EventSource by now, eliminating the live streaming.
Perhaps something to revisit down the line with next gen stuff. But can be parked for now
Has moved on a lot and is mitigated by
https://github.com/pi-hole/AdminLTE/pull/2215
https://github.com/pi-hole/AdminLTE/pull/2142
making the online debug log auto scrolling, with colors (inkl. the token) and a hint where the token is added.

