I am happy to help.
These are the general steps I took to visualize my Pi-hole data using Prometheus and Grafana, which may or may not work for you. As with everything you read on the internet, please proceed with caution and at your own risk.
The following instructions assume you already have:
- Docker installed on your RPi
- Basic knowledge of Linux and the command line
Step 1
Run the following command in a terminal attached to your Raspberry Pi machine:
docker run -d \
  --name pihole-exporter \
  -p 9617:9617 \
  -e PIHOLE_PASSWORD="YOUR_PIHOLE_PASSWORD" \
  -e PIHOLE_HOSTNAME="localhost" \
  --restart=unless-stopped \
  ekofr/pihole-exporter:latest
Please change the value for PIHOLE_PASSWORD to your own password.
Step 2
Verify the exporter is running by entering the following command in the same terminal as the previous step:
curl http://localhost:9617/metrics
Step 3
Once you have verified the Pihole Exporter is producing logs, add the following to the prometheus.yml file on your Prometheus machine:
scrape_configs:
  # ... your other jobs may be here ...

  - job_name: 'pihole'
    scrape_interval: 15s
    static_configs:
      - targets: ['<YOUR_RPI5_IP_ADDRESS>:9617']
Make sure to change the <YOUR_RPI5_IP_ADDRESS> key to your Raspberry Pi's IP address.
Step 4
After you update your prometheus.yml file, restart Prometheus with the following command:
systemctl restart prometheus
Log into the Prometheus web UI and confirm it is tracking the Pi-hole feed among its targets.
Step 5
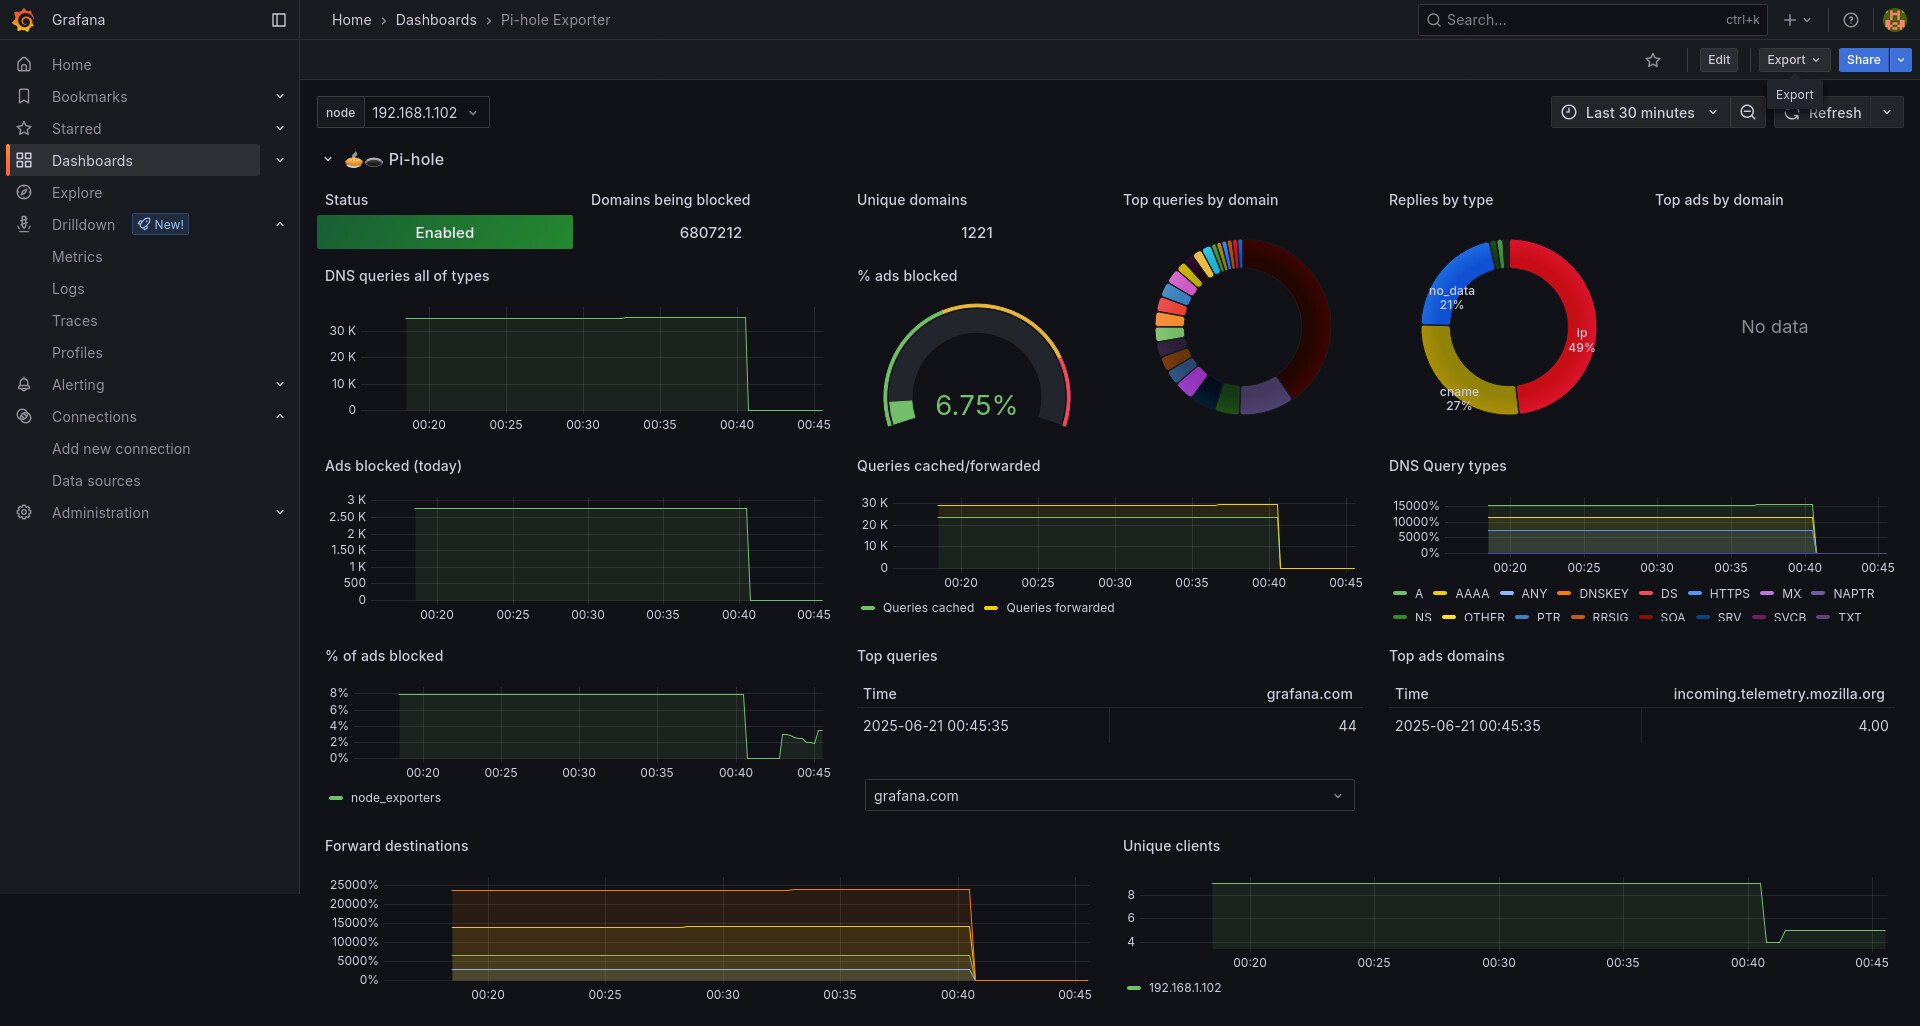
Login to the Grafana web UI and import a new dashboard for the Pi-hole data source using id #10176.
As mentioned at the top of this post, these are quick summaries of the major steps I took. And it works!
If you run into any particular challenges while attempting to do the same thing, I am happy to help debug as best I can.
Good luck!