It's been a few days since the blocking % started to drop drastically, I'm not saying it's bad, but after seeing it at +70-80%, it seems strange to me to see such low percentages, maybe there is something wrong and it's not blocking good?
Apparently not, and the behavior seems correct, but those stats seem pretty low. Although it is also true that because after a few weeks he ended up staying the Raspberry Frozen, I decided to insert a SMART plug to restart the Raspberry once a week, this probably reset the statistics too and it didn't happen before in a month or more.
If a list maintainer changes the domains on the list, the percentage may change;
if you visit different websites (than you visited before), the percentage will change;
even if you always visit the same sites, sites may change their ads and the percentage will change;
also, if you use a browser extension to block ads, the extension will block ads before the browser makes a DNS query. Without a query for an "Ad" domain, the percentage will change.
The important thing is: If you aren't seeing ads it means Pi-hole is working as expected.
Thanks for the suggestions. Perhaps this time ago I will leave some ad blocking extension on, it is good to have them because you block things that does not block pi-hole or in case this stop working.
I'm going to observe a time the behavior of pi-hole and try to draw a conclusion so that the post is helpful to other users too!
I'm also experiencing similar thing last few days but with ads on all devices and total queries dramatically dropped from ~50k to ~5k. Update to last version and update add lists seems not helped much...
I definitely think that the behavior is correct, I do not receive advertising and the bulk of hits go to the Xiaomi router and the LG television and a Samsung product, I don't know if it is the television or a tablet because both have relatively little activity and still do Attempts.
So it seems like it's a bunch of things, an abnormal count by Pi-Hole in my opinion, the weekly resets I practice now and maybe some change between the most blocked lists or devices? Maybe now they have changed and send less information. It must be said that in my wifi mesh network I have changed one of the Xiaomi AX3000 routers for another model that still has less frequent attempts to send information to Chinese servers and that is why it is also a lower % in the statistics.
Issue was with provider DNS - they changed it recently, but I forgot to update it in my configs (I set provider DNS as an upstream). Now all runs nicely, but with Quad9 DNS on upstream, haha. Hope it might be useful for somebody else.
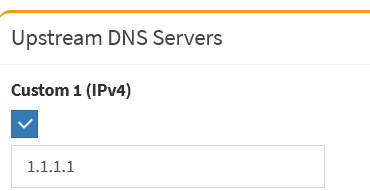
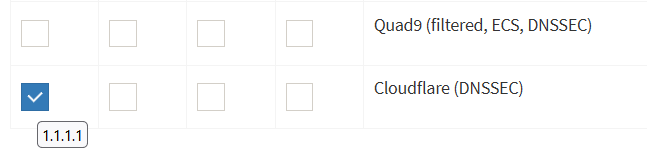
I specified manually IPs for upstream DNS servers (this part is not present on your screenshot, just scroll down a bit and you'll see it) - first DNS is from AdGuard (not from Quad9 as I mentioned earlier, I apologise for my mistake) and second DNS is a server from my ISP (but to be honest - better will be to omit ISP DNS and specify backup AdGuard DNS as well, if you want to block all ads and don't care about ping)
I am not sure if this will increase percentage value on dashboard in all cases but 99.9% ads will be blocked, that's for sure.
Also if you experiencing a lot of similar suspicious requests - you can check option for blocking such clients - it is on the same window as well in "Rate-limiting" section. It should have 1000 requests for 60 seconds as default values. Maybe decreasing these numbers might help you.
I don't quite understand what difference there is between the boxes section of my capture and the other section of DNS Upstreams, I also put 1.1.1.1 and 1.0.0.1 of Cloudfare and it says it saves it but the section remains blank again .
We will give it a few days to see if the % counting issue works better.