Can someone please explain what I am seeing in the admin console? ie what are the two lines in the graph... and what are the circles telling me ?
Sure this has been posted before, but I can't find it 
The top line shows the total number of queries over time, and the lower line shows blocked ads over time. The left circle is a pie graph of the query types (usually IPv4 and IPv6, A and AAAA respectively). The right pie graph shows the amount of queries forwarded to each upstream server.
Both these graphs are not really telling me anything...
In what way do others find this information useful?
What am I missing?
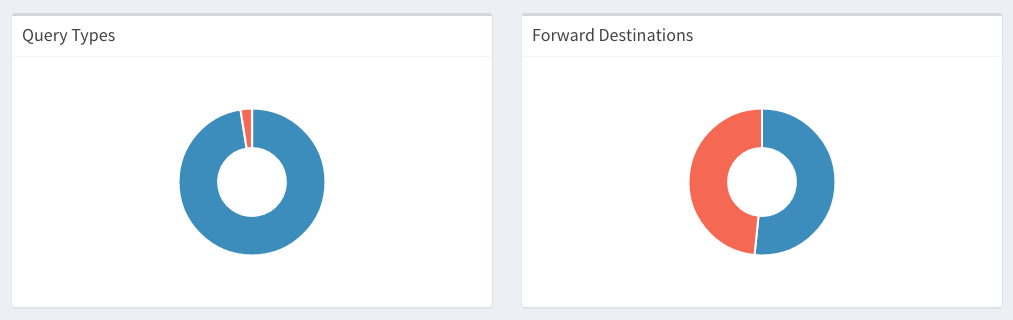
The Query Types can be useful to see how much of your traffic is IPv4 (A) vs. IPv6 (AAAA). In addition, you may see other query types like PTR and TXT. It just gives a visual of what types of traffic is being requested on your network.
The Forward Destinations may not be quite as useful, but the faster upstream server usually wins so you could see that sort of thing.
1 Like