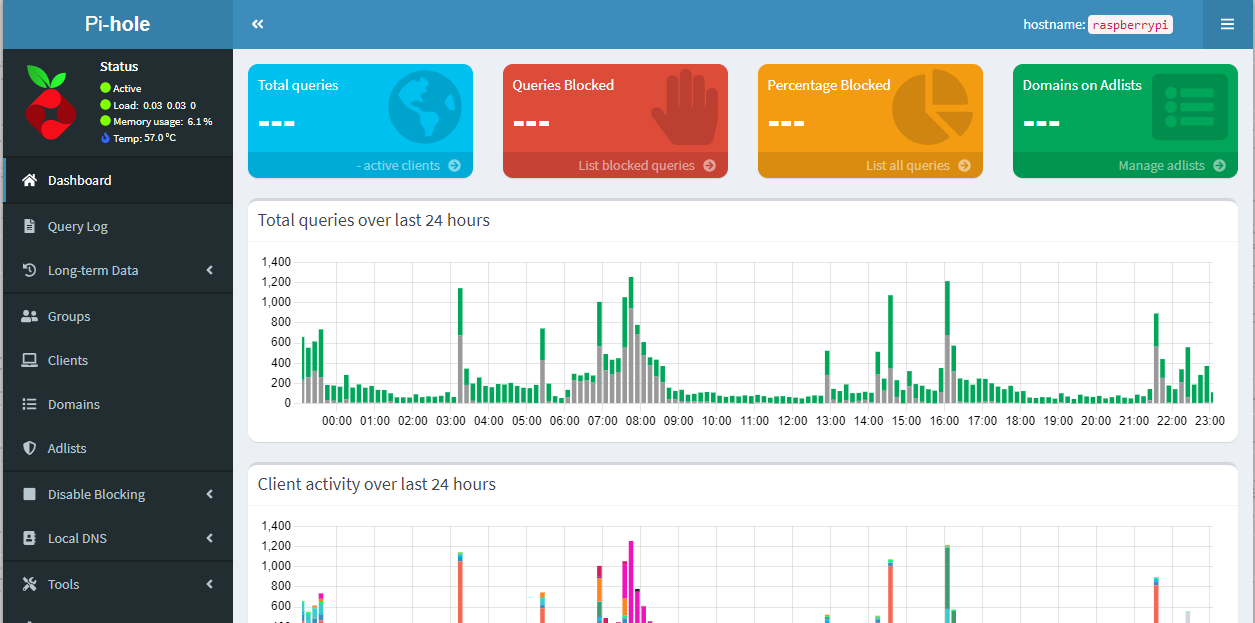
when I log to [192.168.1.7/admin] it all works fine, BUT, on several occasions lately I've noticed the numbers in the 4 graphs are missing ?
I check on phone or tablet using one of several apps, it shows numbers normally
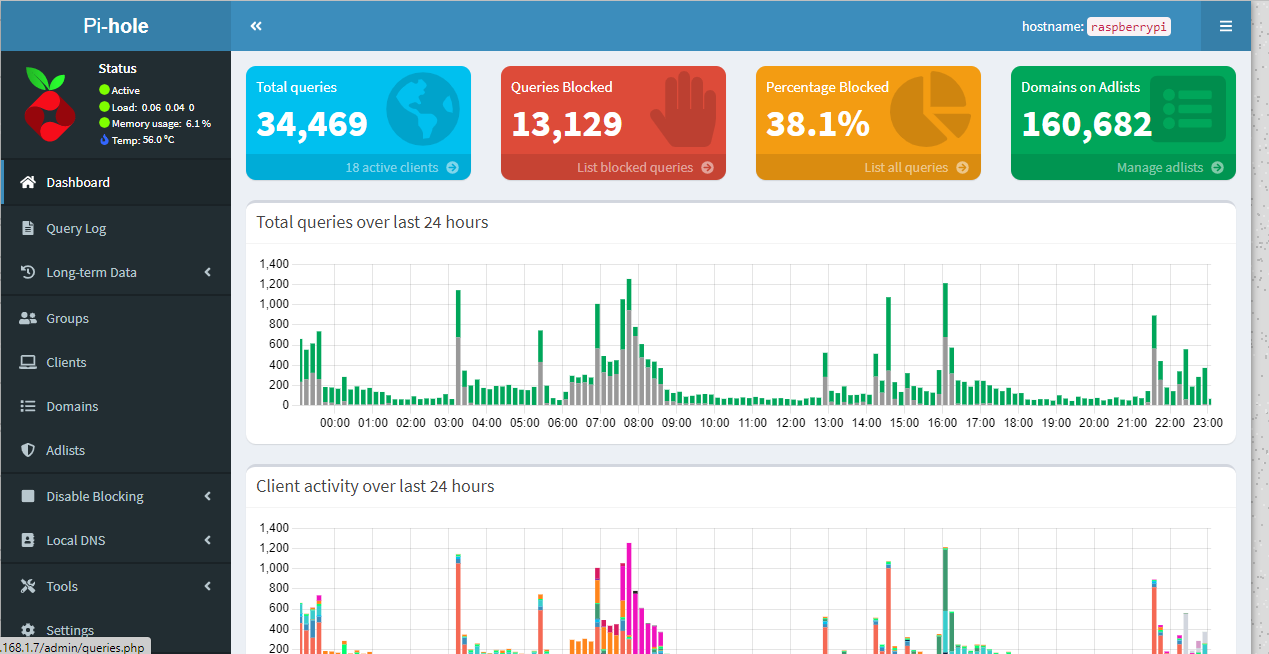
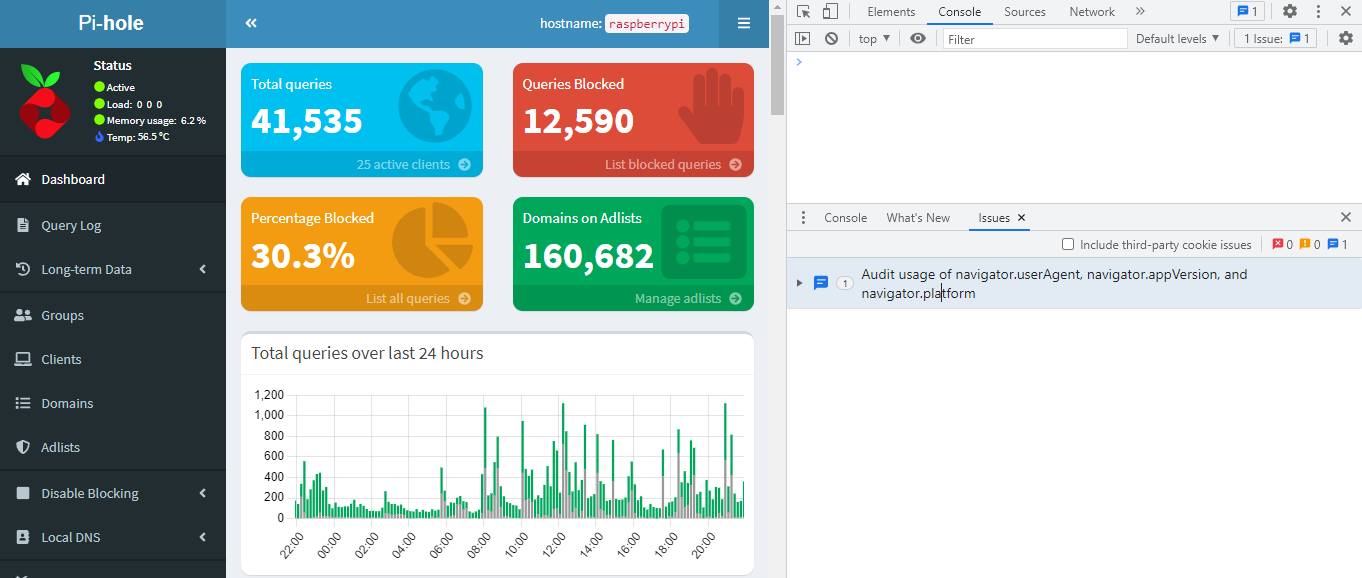
later, I load front page, all works normally ...?
problem on all 3 pi holes
perplexed
Chrome browser on W10
have 3 pi holes: Centos 7 x2 v5.14.1 v5.16.3 v5.17, raspberry pi [v5.14.2][v5.19.2][v5.17]
Centos ones have been installed for quite a while, raspberry pi maybe since a month or so, all works no issues, just, sometimes, no numbers on main screen...?
Thanks for reply. I think? I did try the W10 browser, though, not 100% now. I'll try the debug next, though. I no longer have the issue, had it two or maybe three times in the last week or so.
I'm aware that C7 is not a supported os, that why I've set up rpi pihole and aim to either set another one or move the C7 machine(s) to C8 or a supported os hopefully soon
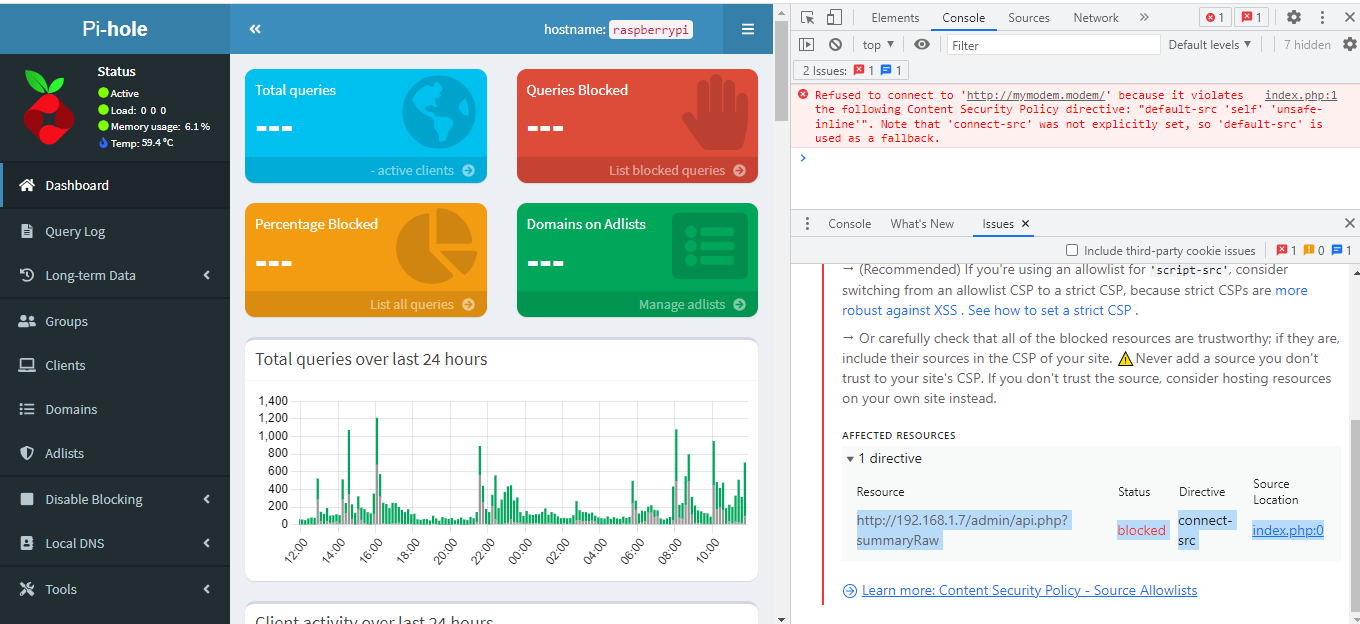
hmm: this was on the laptop yesterday, just brought laptop up, the browser tabs are still open from last night,
on # 1 it says:
Refused to connect to 'http://mymodem.modem/' because it violates the following Content Security Policy directive: "default-src 'self' 'unsafe-inline'". Note that 'connect-src' was not explicitly set, so 'default-src' is used as a fallback.
index.php:1 Refused to connect to 'http://mymodem.modem/' because it violates the following Content Security Policy directive: "default-src 'self' 'unsafe-inline'". Note that 'connect-src' was not explicitly set, so 'default-src' is used as a fallback.
other one:
Failed to load resource: net::ERR_NAME_NOT_RESOLVED
mymodem.modem/:1 Failed to load resource: net::ERR_NAME_NOT_RESOLVED
...
mymodem.modem/:1 Failed to load resource: net::ERR_NAME_NOT_RESOLVED
jquery.min.js?v=1668420673:2 GET http://mymodem.modem/ net::ERR_NAME_NOT_RESOLVED
Some resources are blocked because their origin is not listed in your site's Content Security Policy (CSP). Your site's CSP is allowlist-based, so resources must be listed in the allowlist in order to be accessed.
A site's Content Security Policy is set either as via an HTTP header (recommended), or via a meta HTML tag.
To fix this issue do one of the following:
(Recommended) If you're using an allowlist for 'script-src', consider switching from an allowlist CSP to a strict CSP, because strict CSPs are more robust against XSS . See how to set a strict CSP .
Or carefully check that all of the blocked resources are trustworthy; if they are, include their sources in the CSP of your site. Never add a source you don't trust to your site's CSP. If you don't trust the source, consider hosting resources on your own site instead.
I can't replicate the error accessing from any browser (including Chrome).
I can't reproduce it even using the combination of old FTL and current web interface (in a test container).
That was exactly my next suggestion:
Since the error is happening only on Chrome this could be a problem with a cached page.
Try to refresh and clear the browser cache using CTRL+F5 (or CRTL+SHIFT+R).
thanks, appreciate your help.
I guess I'll just keep watching if/when it comes back, and, do I get it on desktop PC or only laptop, anyhow, hardly a show stopper, thank again
In your screenshot it refers to trusting sources and it lists the Source Location as index.php:0 and that looks like a clickable link. Do you get any options if you click it, such as "Trust this source" or anything like that? Might not fix the underlying policy problem – wherever in Chrome that is being triggered – but may offer a way around it.
While in the developer pane you can see at the top you have a Network tab. If you click that you can see that the web interface is trying to load api.php?summaryRaw once per second (this is to how the numbers are obtained and updated to put into the coloured boxes on the Pi-hole Dashboard). Maybe more info is given in this tab when it fails.
If you click the three vertical dots you can change the developer pane docking from the right side to the bottom, where it's easier to see what's going on.
thanks, don't recall anything asking 'trust this' or anything else
I'm not currently having this issue anymore...
I guess I'll try your suggestion if/when I get this again, thanks again