I'm opening this new Feature Request so we can have a single place to discuss about how we would like to shape this idea until it goes into Pi-hole and out to you.
First, let me say that we would like to leave the dashboard as it is right now (information over the day), because it has often proven to be very useful also as a network diagnostics tool. However, we could add - due to the advent of the FTL engine (beta testing) - a "long-term statistics" page where a limited amount of data is shown.
I'm currently thinking about storing a "snapshot" of the statistics at the time the Pi-hole log is flushed, i.e. we keep
over time graph data of each day (graph is kept forever in the same resolution as shown on the dashboard)
Top Domains, Top Advertisers, Top Clients, Forwards Directions, and Query Types data
What we will not keep: Individual Query data (that consumes way too much space on the arbitrary setup).
(Does it make sense to look what you have browsed last Christmas between 09:00:00 and 09:09:59 ?)
I absolutely agree, I personal like the slim GUI/dashboard, it should not be overloaded with "gimmickry".[quote="DL6ER, post:1, topic:1914"]
I'm currently thinking about storing a "snapshot" of the statistics at the time the Pi-hole log is flushed, i.e. we keep
over time graph data of each day (graph is kept forever in the same resolution as shown on the dashboard)
Top Domains, Top Advertisers, Top Clients, Forwards Directions, and Query Types data
What we will not keep: Individual Query data (that consumes way too much space on the arbitrary setup).(Does it make sense to look what you have browsed last Christmas between 09:00:00 and 09:09:59 ?)
[/quote]
I would appreciate the possibility to write all the data into a database e.g. MySQL or postgreSQL. So everyone could decide by them self how long and which data you keep. Space wouldn't be an issue because you could store the data on a different server. It could be interesting to analyse the data over a long period of time. Creating a (interactive) graph would be pretty easy with the tools I have mentioned in the other thread.
EDIT: A database solution would solve all requests, like that, for a more sophisticated graph.
I also have to agree, that an overloaded dashboard is not what I would want.
Also, do keep the data for a year would generate to much data for my little Raspberry.
But in the moment version I cannot even see the full last 24 hours. Only the data since midnight.
That is maybe an improvement, if you can see the data since yesterday at the same time.
Personally, I like statistics. So I would like to have the "Top Advertisers" of the week and/or the month or something like this.
Finally an idea from my side:
How about you give the user the option to set how much space can be used by the saved data? (At the same time calculating how long you could see in the past.)
And maybe also where it should be stored? (Like @Vertux suggested?)
I currently refrain from adding a database interface to FTL, because it is 100% written by ourselves so we have full control also about licensing and I don't have the time to think about the possible implications of adding a library into the business. Over the long-run this is, however, exactly what we will do: Save everything into a database and use some available tools, maybe the ones you mentioned, for sophisticated graphs.
I do the development partially on a Raspberry Pi B+ (also known as "version 1") to ensure that everything works nicely on slow machines. Rest assured that we will never lose sight of the low-performance devices.
That is actually difficult. I will think about this more, but I think I know a good way of how to flush the log depending on its age (where the criterion can be "not older than 24h"). Nevertheless, this will drag along that major parts of the overTime graph generation will have to be re-engineered which just consumes time... Any pull requests or other kinds of (working!) code contributions are always very much welcome! Sadly, I have to say that only partial code contributions are sometimes counter-productive, since it costs lots of time to understand how certain things are meant.
I think the idea should be to keep
the log in up to max 24h intervals
the database with unlimited age (users might setup their own GC routines if space is a hard limitation)
Also predicting is naturaly quite complicated, in my enterprise environment there are days with more than 2 million DNS queries, while there are also days with less than 50'000 entries. Especially if you have a ton of clients you can never predict what they do...
Oh that was new to me. In these days it is unusual that a program does not use an additional library. I can understand your concerns. [quote="DL6ER, post:4, topic:1914"]
Rest assured that we will never lose sight of the low-performance devices.
[/quote] I like that.[quote="DL6ER, post:4, topic:1914"]
Any pull requests or other kinds of (working!) code contributions are always very much welcome! Sadly, I have to say that only partial code contributions are sometimes counter-productive, since it costs lots of time to understand how certain things are meant.
[/quote]
I wish I could support you in coding, I am interested in programming (python) but I am not what you would call a programmer.
[quote="DL6ER, post:4, topic:1914"]
DNS queries, while there are also days with less than 50'000 entries.
[/quote] That remembers me of the 40.000 entries, which my HUE Hub has caused within a couple of minutes yesterday, that was very weird - maybe it does not like to be blocked
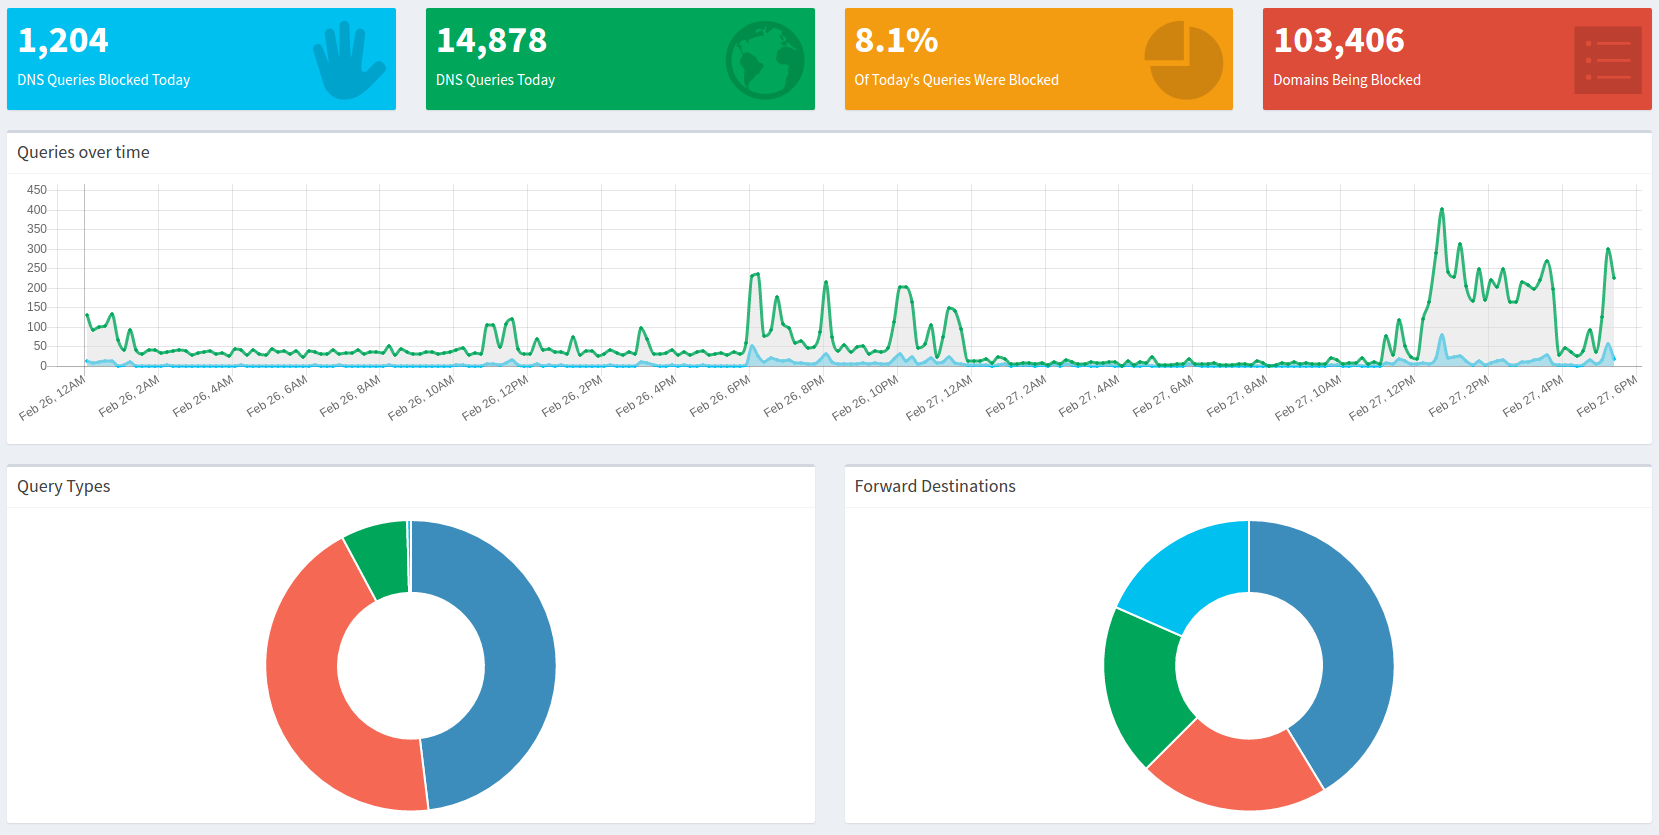
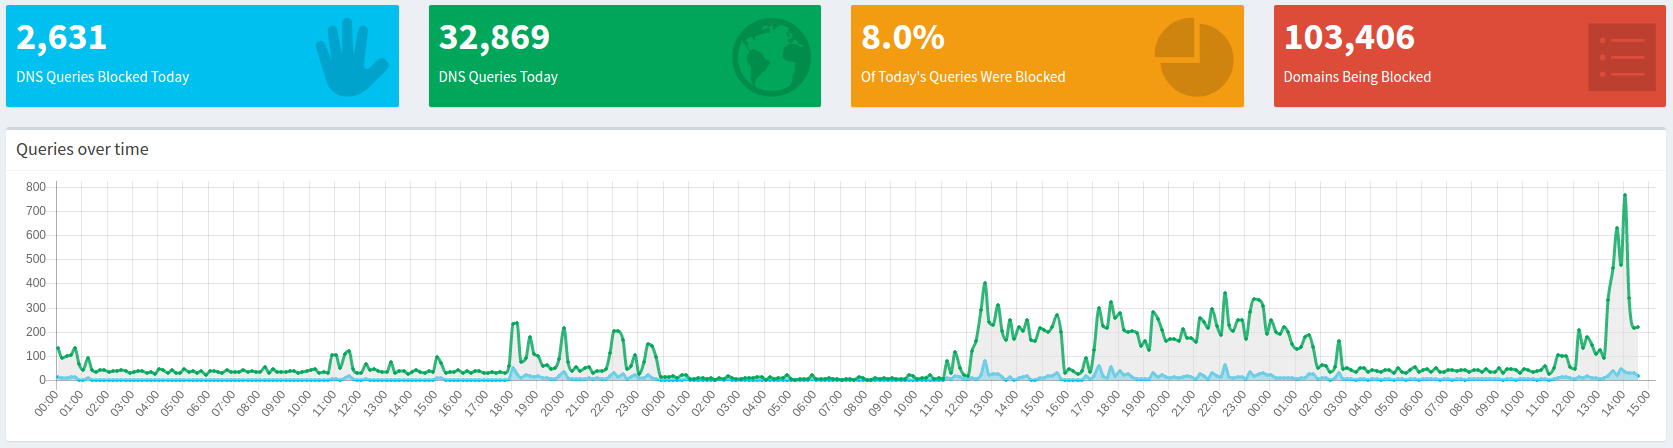
A quick update for you guys: I extended the capabilities of our new FTL drive to deal with non-flushed logs at the midnight-border. Here you can see how my dashboard looks like today (I simply disabled the cron job, so no flushing happened last night and I have > 24h of data in my log file now).
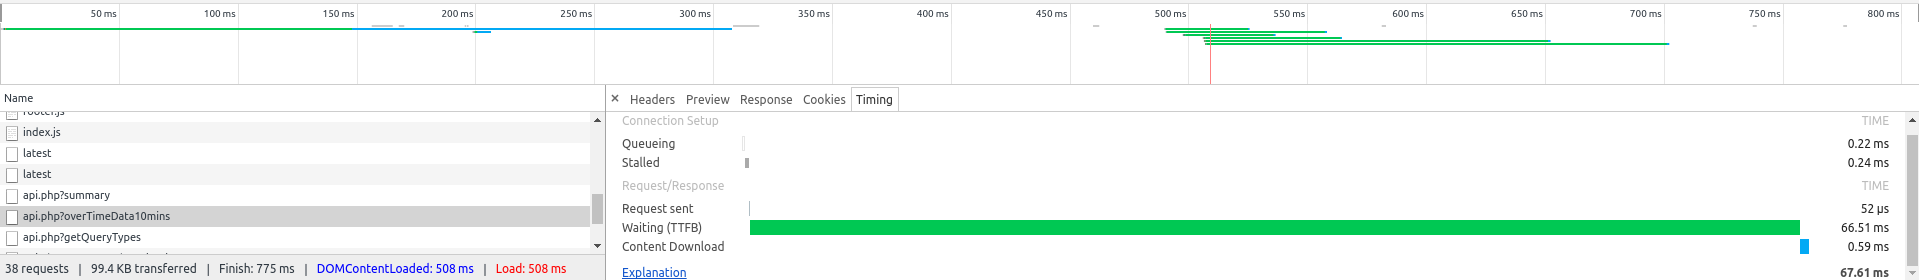
Tested on my Rasberry Pi B+. Loading time of the whole page is about half of a second. Querying the data for the main graph is less than 100 milliseconds:
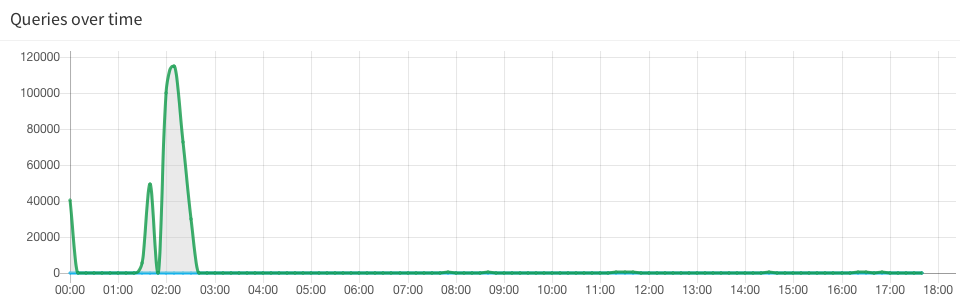
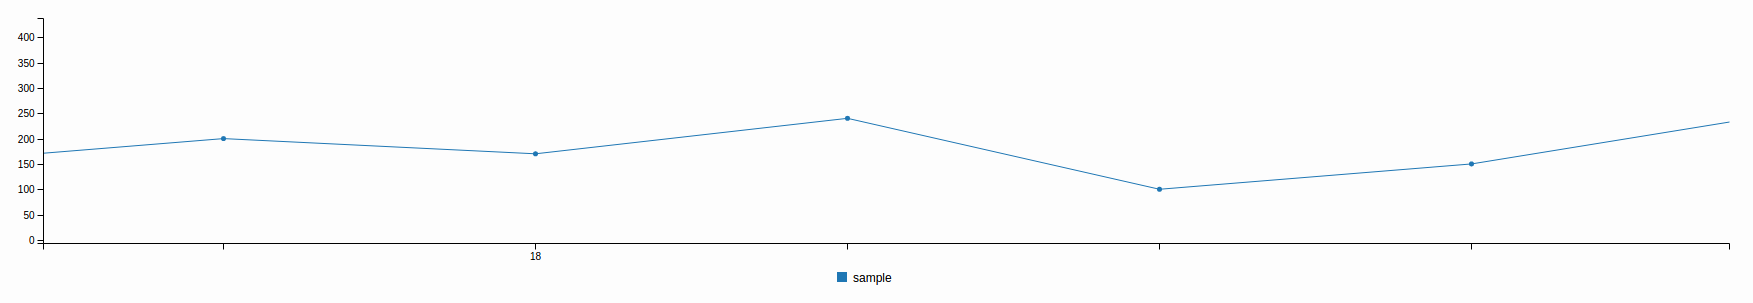
@DL6ER That looks very nice, i like it. Would it be complicated to implement a zoom function ? I am asking because, when there is a high peak all other data become a flat line, which means the graph loses a lot of its significance. Here is a fresh example:
We've talked about RRDtool for long term storage before, is GNU licensing OK? Figuring that out might be worth it compared to re-invinting a nearlly 2 decade old wheel that does it's job very well and is lightweight.
Given we're already using JS I should have considered a noSQL style / raw JSON data backend instead of RRD. Not sure about the performance comparison to a C tool but licensing should be pretty clear cut if just plaintext JSON files were used.
RRDs are a great for known timesliced values (monotonic) so if were are looking at capturing values at known intervals and then aggregating that to daily/weekly/monthly then it may be something to take another look at. The reason RRDs were passed over previously is that the schema of the database wasn't monotonic and would have varying periods of time when data was not modified.
Flot is a great place to get lost in. You can do some really interesting manipulations to the displays and expand/contract the graphs to drill down or up and still get some good granularity. And to second @dl6er, PR's are great!
I guess I miss out on all the fun topics while on vacation! The complete rewrite, to be released when it's done (tm) but after FTL, uses Redis and Python. Moving completely away from Bash opens up a lot of opportunities, and the performance of using Redis and Python is very close (as in almost unnoticeable) to FTL's performance. The API is written using Flask and the web interface is being rewritten in Angular 2, making web development a breeze compared to the current PHP code.
Edit: The information in this comment is subject to change, as the rewrite is still in an early stage and the languages/libraries used may change.
How about just starting with "yesterdays data".
You could use all the routines you already have, parsing the data from pihole.log.1 instead of pihole.log.
Make the boxes ("DNSQueries Blocked Today", "DNSQueries Today", ...) a little smaller and add check boxes "today" and "yesterday"
Sounds easy, probably a little more complicated than this, but the data is there, no additional storage required.
Possibly the same method for "Query Log"
<edit> more days/history ? disable compression in logrotate </edit>