Please follow the below template, it will help us to help you!
Expected Behaviour:
When going to Long term data > Query log, selecting the date and time range, you should see the queries for the selected date and time range.
Actual Behaviour:
Any queries that include "OK (forwarded)" result in "An unknown error occurred while loading the data".
Debug Token:
n40300pnp2
Further Information:
I have searched the forums but only found older posts regarding this error, and none of them seem match this situation. The interesting thing here is that it occurs only when "OK (forwarded)" is checked, if I uncheck this and leave the rest of them checked, then everything, eventually (depending on how many are left checked, I may have to tell the browser several times to wait for the script to complete, no big deal), works as expected.
It is also worth noting that it only takes from about 1 to 5 seconds for the error to appear, and the browser never prompts me to wait for or terminate the script.
Loving Pi-Hole BTW, the developers have done a great job, and it works very well in an enterprise environment.
2019-05-30 08:05:32: (mod_fastcgi.c.2543) FastCGI-stderr: PHP Fatal error: Allowed memory size of 134217728 bytes exhausted (tried to allocate 16777224 bytes) in /var/www/html/admin/api_db.php on line 172
in your Tricorder log (/var/log/lighttpd/error.log). At first glance, it looks like you have just too many queries with the OK (forwarded) status and the process dies because it cannot handle all of them.
Does the error still appear if you query only, let's say, one hour of data?
Unfortunately, yes it does. I've even tried backing it off to 1/2 hour in the middle of the night when there is very little usage and the error pops right up.
Ran it twice at 8:47am with no new lines showing up:
2019-05-29 11:58:38: (server.c.1828) server stopped by UID = 0 PID = 1
2019-05-29 11:59:18: (log.c.217) server started
2019-05-29 12:05:19: (mod_fastcgi.c.2543) FastCGI-stderr: PHP Fatal error:  Allowed memory size of 134217728 bytes exhausted (tried to allocate 20480 bytes) in /var/www/html/admin/api_db.php on line 139
2019-05-29 13:08:18: *.amazonaws.com is not a valid domain
2019-05-29 12:09:42: (mod_fastcgi.c.2543) FastCGI-stderr: PHP Fatal error:  Allowed memory size of 134217728 bytes exhausted (tried to allocate 16777224 bytes) in /var/www/html/admin/api_db.php on line 172
2019-05-29 13:01:30: (server.c.1828) server stopped by UID = 0 PID = 1
2019-05-29 13:01:31: (log.c.217) server started
2019-05-29 13:23:39: (mod_fastcgi.c.2543) FastCGI-stderr: PHP Fatal error:  Allowed memory size of 134217728 bytes exhausted (tried to allocate 16777224 bytes) in /var/www/html/admin/api_db.php on line 172
2019-05-30 08:04:58: (mod_fastcgi.c.2543) FastCGI-stderr: PHP Fatal error:  Allowed memory size of 134217728 bytes exhausted (tried to allocate 16777224 bytes) in /var/www/html/admin/api_db.php on line 172
2019-05-30 08:05:32: (mod_fastcgi.c.2543) FastCGI-stderr: PHP Fatal error:  Allowed memory size of 134217728 bytes exhausted (tried to allocate 16777224 bytes) in /var/www/html/admin/api_db.php on line 172
Ran it again at 8:48-8:49 and got these two lines in the error log:
2019-05-30 08:48:56: (mod_fastcgi.c.2543) FastCGI-stderr: PHP Fatal error:  Allowed memory size of 134217728 bytes exhausted (tried to allocate 16777224 bytes) in /var/www/html/admin/api_db.php on line 172
2019-05-30 08:49:32: (mod_fastcgi.c.2543) FastCGI-stderr: PHP Fatal error:  Allowed memory size of 134217728 bytes exhausted (tried to allocate 16777224 bytes) in /var/www/html/admin/api_db.php on line 172
I think you've put me on the right track here. I increased the PHP memory usage from 128M to 256M, restarted Lighttpd and ran the queries for a 1/2 hour time interval from 2:00am to 2:30am. These returned just fine. Beyond 1/2hour and I get the error again.
It should be noted that the "quiet" interval here is not what a lot of people would consider quiet, as we run a 24/7 environment. That's just the time when the usage it at its lowest.
The Pi-Hole server is running in a VM with 2GB RAM, how much memory would you suggest letting PHP have?
OK, now I'm not convinced that it's entirely a memory issue. I increased PHP's memory to 512M and restarted Lighttpd. Still hitting the error when querying more than 1/2 hour (2:00am to 2:30am) and htop is showing PHP-CGI using 279M and nothing showing up in the Lighttpd error log.
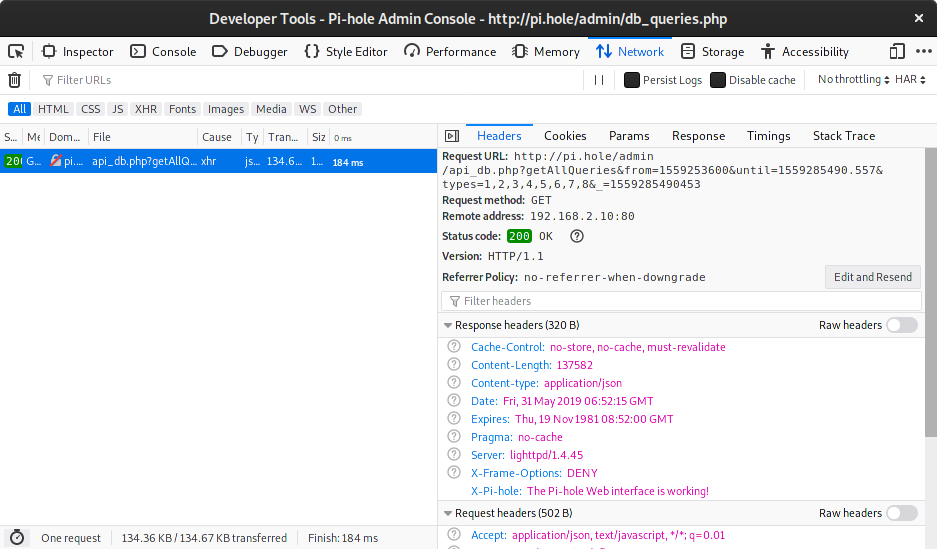
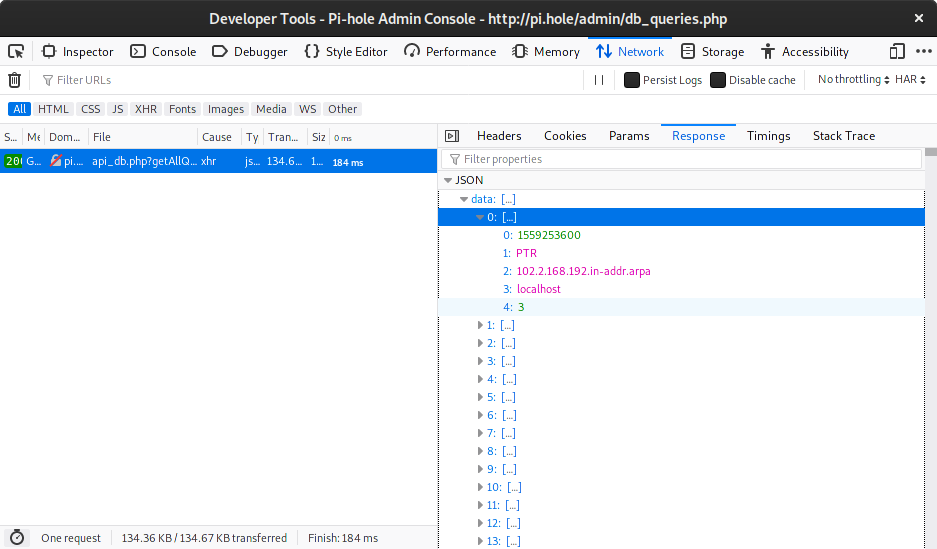
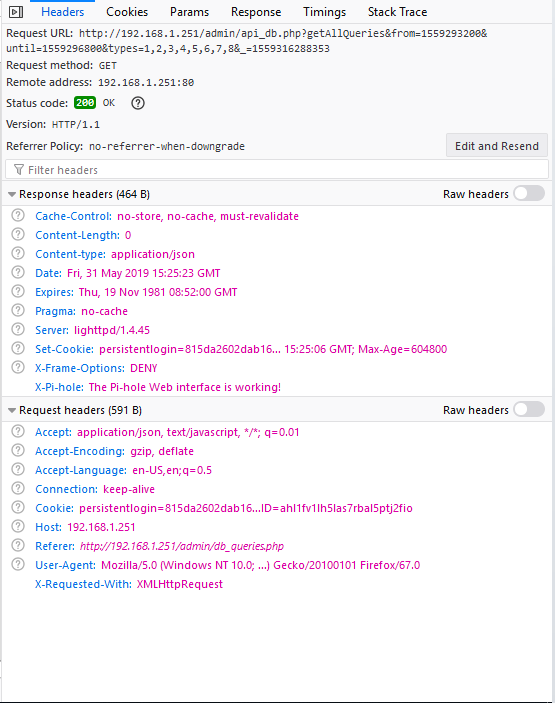
Something must be causing the error. If it is not in the log, it should be in the Console of your browser. If not, please try with another browser and see if you get the same error (and no output in the Console) there.
It is possible that there may be another issue like there are entries in the database that cause issues, but we first have to narrow this down before we can make any progress in this direction.
OK, I've tried it in Firefox, Chrome and Edge, nothing showing the the Lighttpd error.log, but getting the same error in all three browsers, "An unknown error occurred while loading the data". The only error I'm seeing in the browser consoles is a deprecation warning from moment.min.js stating that the value provided is not in a recognized ISO format, this occurs immediately after selecting the time. No errors show when clicking apply and waiting for the query results.
I wonder if it could have anything to do with there being several domains in the database that can't be converted to UTF-8? I have a small Python script that I used to query the pihole-FTL.db database and it errored out on several that, after converting to ISO-8859-1, I found had some interesting characters.
My apologies, it was a busy week last week. So, I've deleted those entries that contained the domains that couldn't be converted to UTF-8. I reran the Long Term Data > Query Log. Selecting a 24hr time period it errored out after 9-10 seconds, same error. I tried shortening the time period to 1 hour and everything worked as expected. I've increased the time period in 1 hour increments back up to 24hrs and its working, granted the browser complains about the amount of time the script takes to complete, but if you keep telling it to wait, it does finish properly now. 26,389 queries in a 24hr period, successfully returned. So, its looking to me like the unconvertable characters where the issue.