FTL Version v2.4.1 uses 450 MB; is this normal? how can I influence (control) this behaviour?
upgraded to Pi-hole Version vDev (development, v2.12.1-343-gc3c554f) Web Interface Version vDev (devel, v2.4-283-gc7693fd) FTL Version v2.4.1 and everything seems normal now...
mmm. looks like a memoryleak: slowly using more and more memory:
18:03 49468
18:15 50052
18:24 50348
18:30 50640
19:85 59136
43:09 174M
This behavior is expected as FTL caches all data that is shown on the dashboard in memory. This is essential for fast retrieval of the data, since we know that SD cards are slow.
Please run pihole-FTL inside a memory leak detector (like valgrind) if you suspect that memory is leaking somewhere.
As only a 25h window is showed on the dashboard I would not expect this behaviour.
I upgraded to 2.5 which seems to need about 40MB (stable). I will keep an eye on memory usage.
Since the log file is flushed every 24h, we have to keep two files in memory to be always able to show full 24 hours of data. These two files can be (at maximum) 48 hours in total. Memory is not released in between, to be able to deliver any requested data (and eventually we might want to store this data in a data base for long-term analysis).
Only when the log is flushed, the allocated memory is freed to ensure that (at most) 48 hours of queries is kept.
Furthermore, FTL has an option (via its config file) to show always show all data in memory (which increases up to 48h max) without cutting out the 24h window.
I am running FTP 2.6 and there does seem to be a memory leak. Even on a pihole that has no clients using it, FTL keeps growing. On my main pihole instance I am now restarting FTP every 30 minutes.
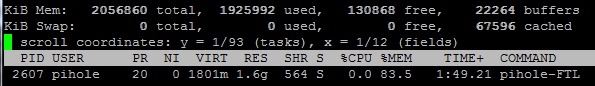
I agree, seems that there is a serious memory leak problem. After less than 24h running in my system it consumes 85% of system memory
Best Regards,
@gmrza @yonesmit
We have not been able to reproduce any memory leak (which does not necessarily mean there is none, of course). Please run pihole-FTL in a memory leak detector (e.g. valgrind) to investigate where the leak happens. I'll be away for about one week, but promise to work with high priority on whatever you find once I'm back.
I did a quick attempt at running pihole-FTL in valgrind this morning:
valgrind --tool=memcheck --leak-check=yes /usr/bin/pihole-FTL 2>&1 | tee /tmp/va4.txt

Unfortunately, it complained that it choked on an illegal instruction - probably a problem with valgrind.

disInstr(arm): unhandled instruction: 0xF4A170ED
                 cond=15(0xF) 27:20=74(0x4A) 4:4=0 3:0=13(0xD)
==7346== valgrind: Unrecognised instruction at address 0x4844f38.
==7346==    at 0x4844F38: ??? (in /usr/lib/arm-linux-gnueabihf/libarmmem.so)
==7346== Your program just tried to execute an instruction that Valgrind
==7346== did not recognise.  There are two possible reasons for this.
==7346== 1. Your program has a bug and erroneously jumped to a non-code
==7346==    location.  If you are running Memcheck and you just saw a
==7346==    warning about a bad jump, it's probably your program's fault.
==7346== 2. The instruction is legitimate but Valgrind doesn't handle it,
==7346==    i.e. it's Valgrind's fault.  If you think this is the case or
==7346==    you are not sure, please let us know and we'll try to fix it.
==7346== Either way, Valgrind will now raise a SIGILL signal which will
==7346== probably kill your program.
==7346==
==7346== Process terminating with default action of signal 4 (SIGILL)
==7346==  Illegal opcode at address 0x4844F38
==7346==    at 0x4844F38: ??? (in /usr/lib/arm-linux-gnueabihf/libarmmem.so)
==7346==
==7346== HEAP SUMMARY:
==7346==     in use at exit: 5 bytes in 1 blocks
==7346==   total heap usage: 71 allocs, 70 frees, 6,296 bytes allocated
==7346==
==7346== LEAK SUMMARY:
==7346==    definitely lost: 0 bytes in 0 blocks
==7346==    indirectly lost: 0 bytes in 0 blocks
==7346==      possibly lost: 0 bytes in 0 blocks
==7346==    still reachable: 5 bytes in 1 blocks
==7346==         suppressed: 0 bytes in 0 blocks
==7346== Reachable blocks (those to which a pointer was found) are not shown.
==7346== To see them, rerun with: --leak-check=full --show-reachable=yes
==7346==
==7346== For counts of detected and suppressed errors, rerun with: -v
==7346== Use --track-origins=yes to see where uninitialised values come from
==7346== ERROR SUMMARY: 55 errors from 43 contexts (suppressed: 0 from 0)
Damn, I can't work out how to attach a file in discourse.... Is anyone able to help? - I don't want to copy and paste the output of valgrind into here....
You can paste in to a site like PasteBin and then post the link. I'll edit your post to code block the section that you did paste here for you.
dschaper@nanopineo:/tmp$ sudo valgrind --tool=memcheck --leak-check=full --show-leak-kinds=all /usr/bin/pihole-FTL
==24976== Memcheck, a memory error detector
==24976== Copyright (C) 2002-2015, and GNU GPL'd, by Julian Seward et al.
==24976== Using Valgrind-3.11.0 and LibVEX; rerun with -h for copyright info
==24976== Command: /usr/bin/pihole-FTL
==24976==
FTL started!
==24976==
==24976== HEAP SUMMARY:
==24976==     in use at exit: 5 bytes in 1 blocks
==24976==   total heap usage: 298 allocs, 297 frees, 233,648 bytes allocated
==24976==
==24976== 5 bytes in 1 blocks are still reachable in loss record 1 of 1
==24976==    at 0x4840AB4: calloc (vg_replace_malloc.c:711)
==24976==    by 0x10B6EF: getUserName (daemon.c:228)
==24976==    by 0x10A70D: main (main.c:18)
==24976==
==24976== LEAK SUMMARY:
==24976==    definitely lost: 0 bytes in 0 blocks
==24976==    indirectly lost: 0 bytes in 0 blocks
==24976==      possibly lost: 0 bytes in 0 blocks
==24976==    still reachable: 5 bytes in 1 blocks
==24976==         suppressed: 0 bytes in 0 blocks
==24976==
==24976== For counts of detected and suppressed errors, rerun with: -v
==24976== ERROR SUMMARY: 0 errors from 0 contexts (suppressed: 6 from 6)
==24977==
==24977== HEAP SUMMARY:
==24977==     in use at exit: 5 bytes in 1 blocks
==24977==   total heap usage: 297 allocs, 296 frees, 232,624 bytes allocated
==24977==
dschaper@nanopineo:/tmp$ ==24977== 5 bytes in 1 blocks are still reachable in loss record 1 of 1
==24977==    at 0x4840AB4: calloc (vg_replace_malloc.c:711)
==24977==    by 0x10B6EF: getUserName (daemon.c:228)
==24977==    by 0x10A70D: main (main.c:18)
==24977==
==24977== LEAK SUMMARY:
==24977==    definitely lost: 0 bytes in 0 blocks
==24977==    indirectly lost: 0 bytes in 0 blocks
==24977==      possibly lost: 0 bytes in 0 blocks
==24977==    still reachable: 5 bytes in 1 blocks
==24977==         suppressed: 0 bytes in 0 blocks
==24977==
==24977== For counts of detected and suppressed errors, rerun with: -v
==24977== ERROR SUMMARY: 0 errors from 0 contexts (suppressed: 6 from 6)

dschaper@nanopineo:/tmp$ file /usr/bin/pihole-FTL
/usr/bin/pihole-FTL: ELF 32-bit LSB shared object, ARM, EABI5 version 1 (SYSV), dynamically linked, interpreter /lib/ld-linux-armhf.so.3, for GNU/Linux 2.6.32, BuildID[sha1]=7942c14781b97504df0c5132617b6bd1869df6a3, not strippedPi-hole Version vDev (development, v3.0-19-ge9c4e81) Web Interface Version vDev (devel, v3.0-5-g470119c) FTL Version v2.6
I found that memory leak only happen when using webinterface with user logged in displaying dashboard.
Then memory consumption increases quite fast. If user close the browser then memory usage stops growing.
I hope this helps to find the cause.
Best Regards,
I was not sure but I had the same impression: as soon as I login at http://pi.hole/admin/index.php?login I can see the memory grow...
My PiHole exhibits the same behavior - it swallows up all available memory and then reports that the FTL engine is offline in less than 24hours of uptime.
This has occurred 3 days in a row now.
This used to work just fine and the only change I've introduced is the upgrade to PiHole3.
As previous users mentioned, I keep the webadmin interface open during these sessions.
Info:
PiHole v3.0.1
WebAdmin v3.0.1a
I've put the output on Google Drive.
There are two samples stored in the folder which I have shared:
Pihole valgrind output
Thanks for tidying up my earlier post.
Even though valgrind croaked (I think it is a problem with valgrind, not with pihole-FTL) I hope the output does give some useful pointers.
As a workaround, you can create a cron job that runs the following:
/usr/sbin/service pihole-FTL restart
That will keep you running in the interim. I am running pihole on a first gen Pi model B (with 256M of RAM) and I am running that cron job every 30 minutes and I seem to be fine for now.
I have the following line in root's crontab:
0,30 * * * * /usr/sbin/service pihole-FTL restart
Regards,
Geoff.
1 Like
Hi,
It looks like you're running into Valgrind on the Pi - any progress? - Raspberry Pi Forums this old bug with running valgrind on the rpi.
Are you able to comment out the line in the file mentioned to work around the issue and rerun the valgrind check successfully then ?
Best,
Eliu
1 Like
@eliudnir:
I followed the workaround for valgrind and posted a new pastebin:
valgrind --tool=memcheck --leak-check=full /usr/bin/pihole - Pastebin.com
1 Like