Ok, I'll watch and report back. It usually takes several hours for the problem to manifest.
I have an example again. I will DM you the readout.
Hi,
it seems I have the same issue.
I use
Core** vDev (development-v6, c771739f)
FTL** vDev (development-v6, 9e3ccd91)
Web interface** vDev (development-v6, da7c0efb)
After running for some time the "other clients" go crazy. A restart usually fixes the issue.
I use dualstack IPv4 and IPv6.
I am unable to upload a screenshot at this time (Sorry, an error has occured)
I believe a solution is in process. Hang tight. ![]()
Short version: Yes, it should be fixed.
Long version (you can skip that if you are not interested but I'd like to know how it was fixed)
The problem arises once the first client gets recycled. This also explains why I have not been able to see it myself - all my devices consistently made queries and none was recycled. What happens here is that we build a table of clients that is sorted by their activity, image it looking like
| client ID | count |
|---|---|
| 0 | 134 |
| 1 | 345 |
| 2 | 456 |
| 3 | 43 |
| 5 | 96 |
| 6 | 52 |
| 8 | 12 |
| 0 | 0 |
| 0 | 0 |
In this example, client with IDs 4 and 7 were skipped because they've been recycled. However, as the table is as long as we have clients which leaves two "empty" rows initialized with zeros at the end.
After sorting, this table looks like
| client ID | count |
|---|---|
| 2 | 456 |
| 1 | 345 |
| 0 | 134 |
| 5 | 96 |
| 3 | 43 |
| 6 | 52 |
| 8 | 12 |
| 0 | 0 |
| 0 | 0 |
leaving the client with ID 0 at the end. Two times, even. This now leads to the pathological observation that the client with ID 0 is counted three times: Once as the client with the third-most activity and then twice summarized in the "other" client.
The solution to this is as obvious as you'd think: Once I realized what was happening here, we simply stop reading from the table above after having read the number of non-skipped clients, i.e., we stop reading after client 8 in the example effectively avoiding erroneously summing up the zeroth client (possible even multiple times).
Setting the limit to 100 actually made this obvious: The client with ID 0 appeared once up and then again multiple times at the end of the table.
The fix is already pushed and ready for further testing. I'm very sure the issue is fixed now ![]()
1 Like
Just updated and will keep an eye on it. ![]()
1 Like
12 hours in and the issue has not returned. It would have previously by now. I believe it's fixed but I'll give it another 12 hours before calling it solved just to make sure.
1 Like
24 hours later and no issue. Marked as solved. Thanks!
1 Like
Same here. Running for 20 hrs and everything is fine!
Is the fix merged already?
No, not yet.
Hello @DL6ER,
I still observe this behavior after 24h without any queries:
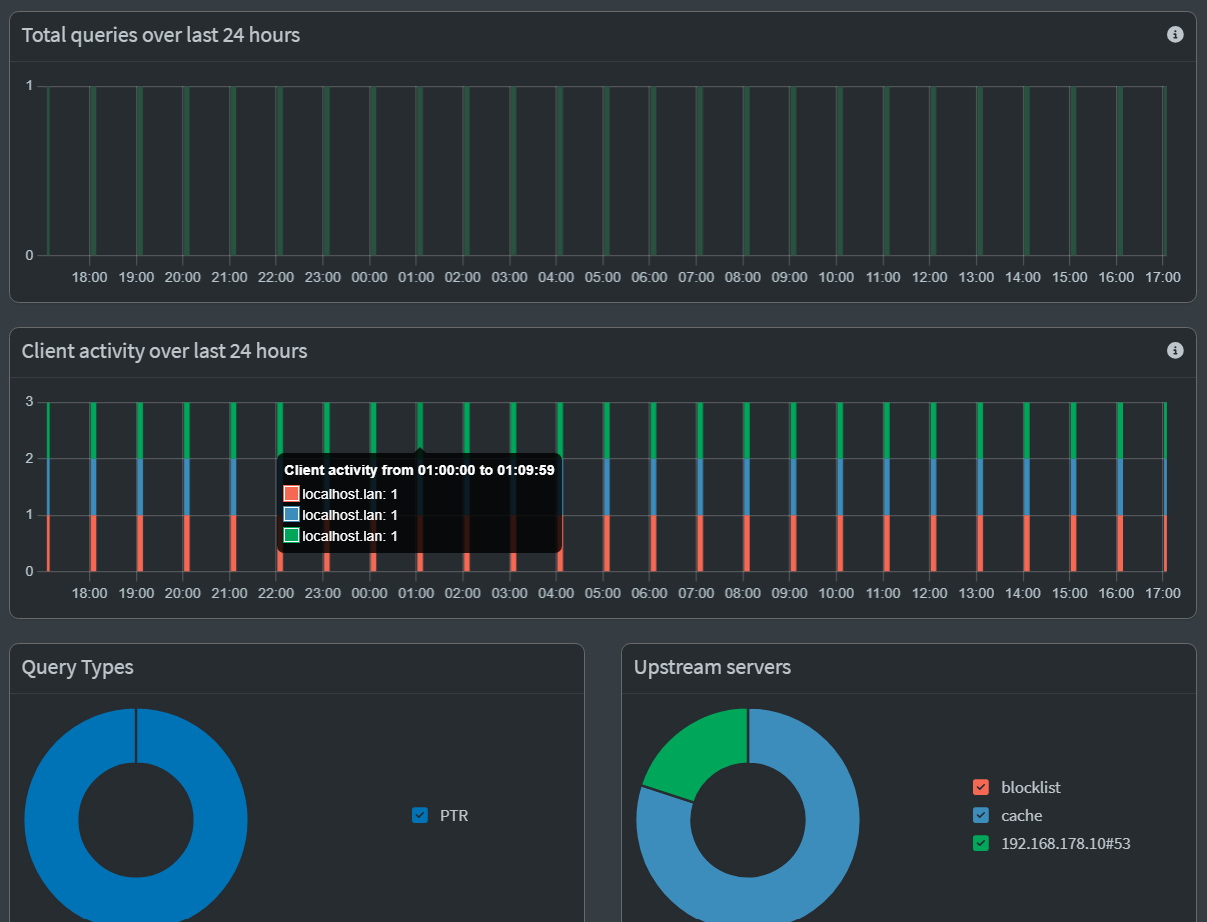
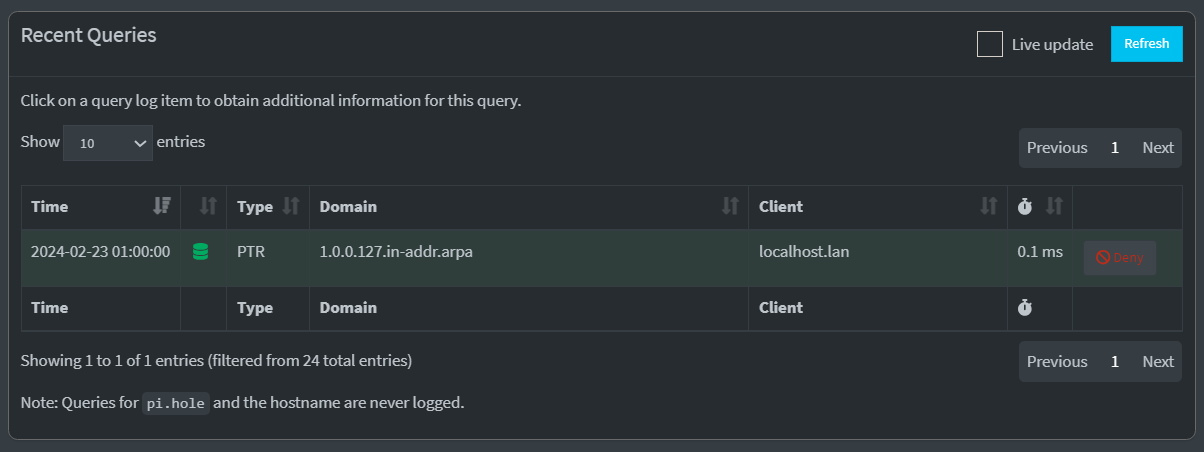
The only query, e.g. in time range from 1:00:00 to 1:09:59, was generated by the localhost itself. But in the client activitiy chart that comes up triple.
Is that normal?
Debug token: 4PKHT7wz
You are on the development-v6 branch. The code that fixes this issue hasn't been merged into the development-v6 branch yet.
1 Like
thanks, you are right.
I overlooked that the PRs mentioned above didn't merged yet ![]()
![]()
Edit: I now switched to the fix/overTimeGraphs branches for testing.
The PRs have been reviewed and merged into development-v6. Everyone participating in here, please run
pihole checkout ftl development-v6
pihole checkout web development-v6
to get back on track and continue receiving further updates in the future. Thanks for helping is creating and verifying this bug fix!
2 Likes