Please follow the below template, it will help us to help you!
Expected Behaviour:
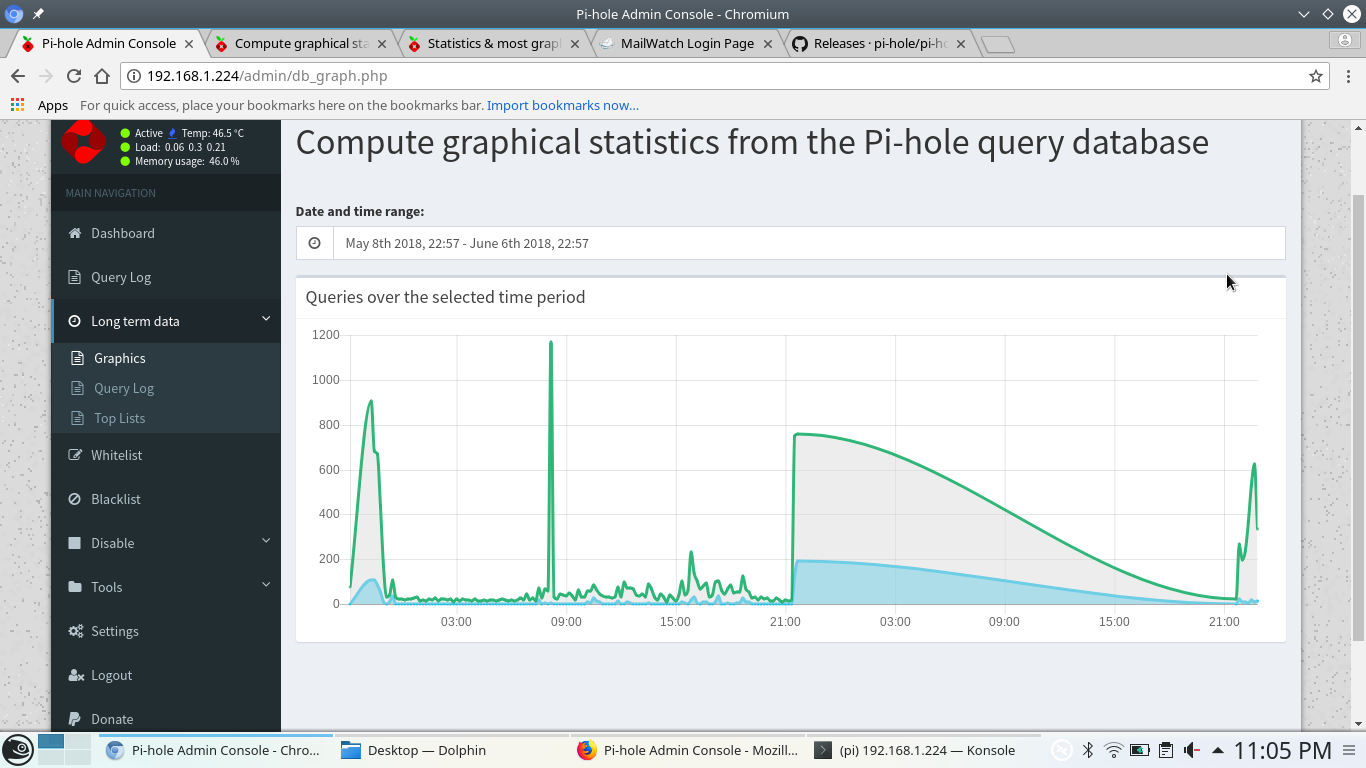
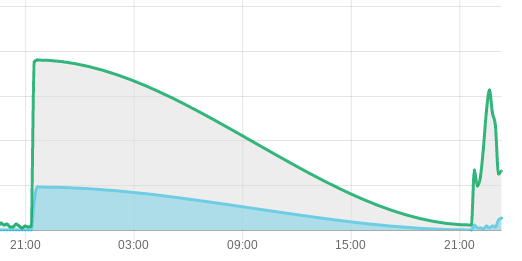
Statistics being displayed over the in the dates selected period, or in the range of the predefined last month, last year etc.
Actual Behaviour:
The same graph is being displayed with the exception of the overall selection. Also the time-scale is not adjusted below the graph.
Running on an Pi3 , stretch, latest updates as of time of writing.
Pi-hole version 3.3.1 , timesynct with the debian servers using chrony
Change of browser does not resolve ( Chromium, Firefox and Midori );
Flushing logs on pi-hole ftl
Clearing Cache did not resolve;
Reboot did not resolve;
I suspect the image/png that is being generated in the background is not overwritten/refreshed.
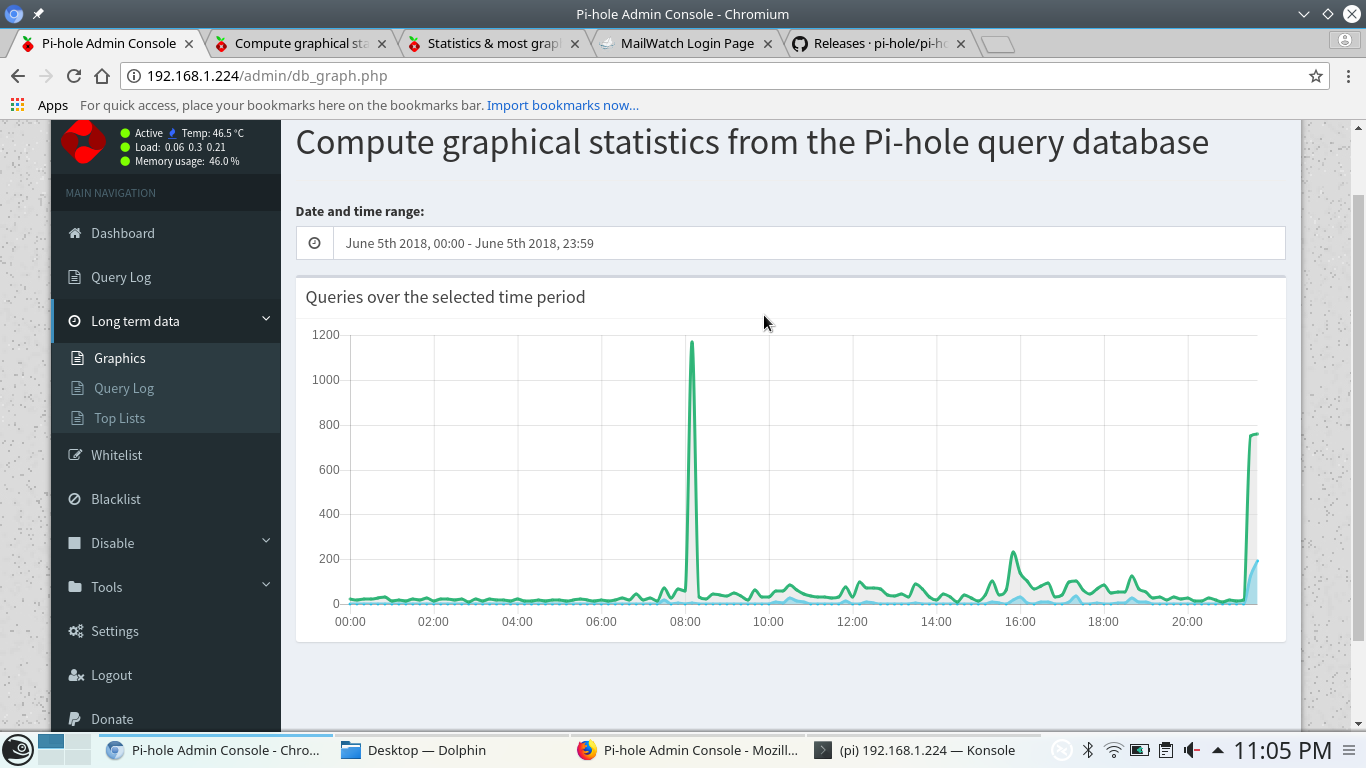
thank you for your reply. Attached are screenshots from last moth, 30days, 7 days and yesterJunday.. The strange thing is, the yesterday selection does adjust the graph. Other preselected timeframes don't and manually entered selections also fail.
The pi-hole is running for a few weeks.. ( this was a re-install since the upgrade broke more then alcohol could fix) .
This behavior was present before i flushed all the logs.. When i run the query logs over the all time range it produces stats that are not possible in a time-frame of 2 days 173k+ in queries. A quick sum of today and yesterday does not exceed 15k in queries ( since the graph hover date displays 4-6 as in 2 days ago ) .
I wil check tomorrow if the time-frame shifts, i suspect it to do.
if it is advisable to do a full reset of pi-hole, pls inform me how to do this.
Thanks all.. the period in the graph where Ramset also notes that it's not right is still visable, but everything is logging correct again. I think i will follow technicalpyro's suggestion and remove the FTL db to flush the data and start gathering again.
Thank you for the support,awesome project so i became a patron..


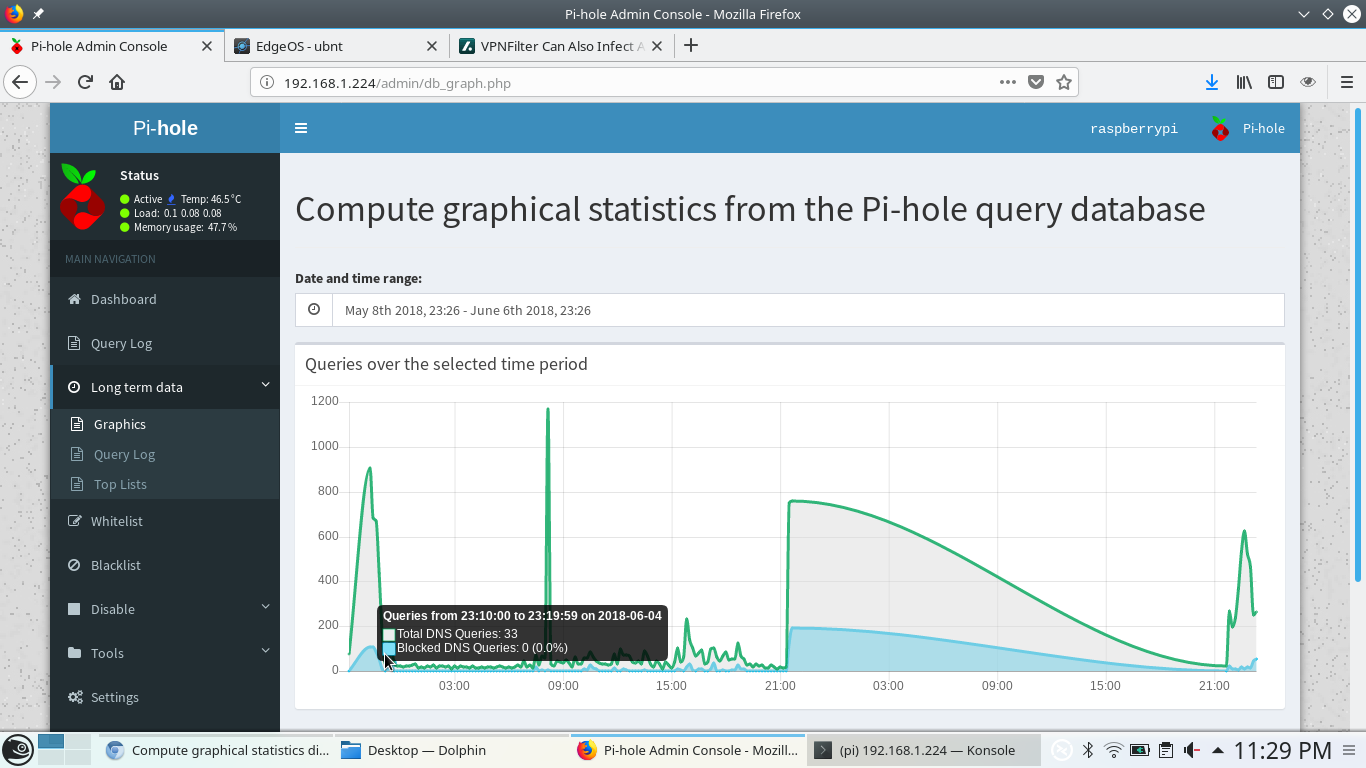
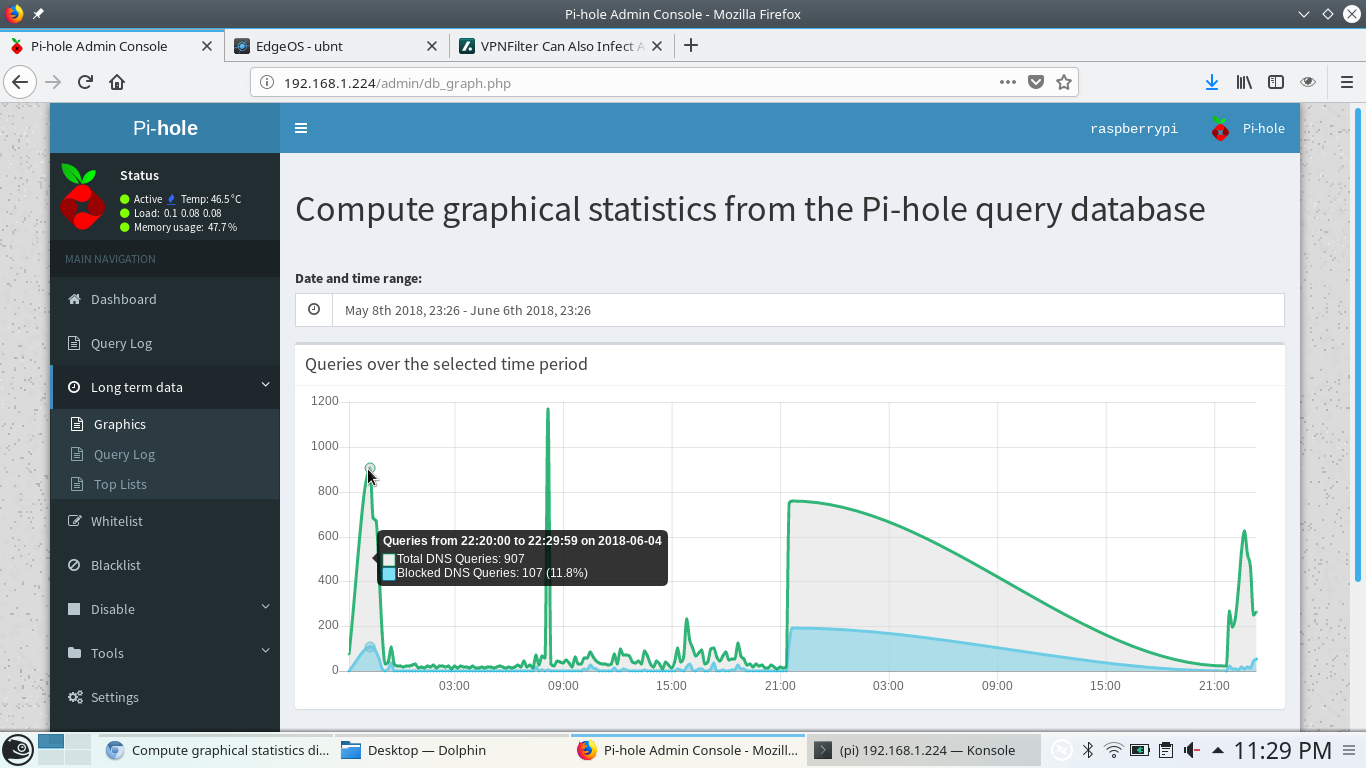
 173k+ in queries. A quick sum of today and yesterday does not exceed 15k in queries ( since the graph hover date displays 4-6 as in 2 days ago ) .