Driving the AtomMan Display on Linux with screen.py
For anyone tinkering with the AtomMan USB serial display, I’ve been working on a Python daemon that brings it fully alive on Linux. The little panel ships with a Windows tool, but out of the box there’s no support at all for Linux. The vendor hasn’t provided any drivers or tools for Linux, and realistically they never will. That means under Linux, the screen just sits there with the AtomMan logo showing and nothing else.
I got tired of that, so I built this.
Why I Built This
The AtomMan panel speaks its own serial protocol. Every tile on the screen expects a payload with metrics in a very particular format (for example, CPU frequency must be in kHz, not MHz). Without the right handshake sequence, the panel stays locked. The Windows software takes care of this behind the scenes, but if you’re running Linux you’re stuck with a blank display.
I wanted a daemon that could sit in the background, keep the panel updated, and optionally show the same stats in a console dashboard for debugging. It also needed to survive reboots, so it’s packaged to run nicely as a systemd service.
What It Does
- Unlocks the screen reliably at boot (with retries if the device is slow to wake up).
- Updates every tile in rotation: CPU, GPU, memory, disk, date/time, weather, network throughput, volume, and battery.
- Reads fan speed from Linux
hwmonor NVIDIA’snvidia-smioutput. - Auto-scales network traffic numbers to K/s, M/s, or G/s.
- Displays CPU frequency in kHz (because that’s what the panel expects).
- Can run in console dashboard mode so you see the same stats on your terminal.
Weather Support
This is where things got interesting.
The original Windows app used a private vendor API. If you sniff the traffic, you’ll see it calling out to an endpoint that requires a vendor key. If you try it yourself, you’ll just get back:
{"status":"You do not have access to this API.","status_code":"AP010002"}
So the Windows weather feed is effectively locked away.
Instead, I wired up OpenWeather. You just drop your OpenWeather API key into the script, and it will pull the current conditions every 10 minutes (interval is configurable).
The display itself only understands a numeric weather code (1..40), which maps to baked-in icons. So part of the job is translating OpenWeather’s conditions into one of those numbers. Example:
- “clear sky” → 1
- “broken clouds” → 4
- “light rain” → 6
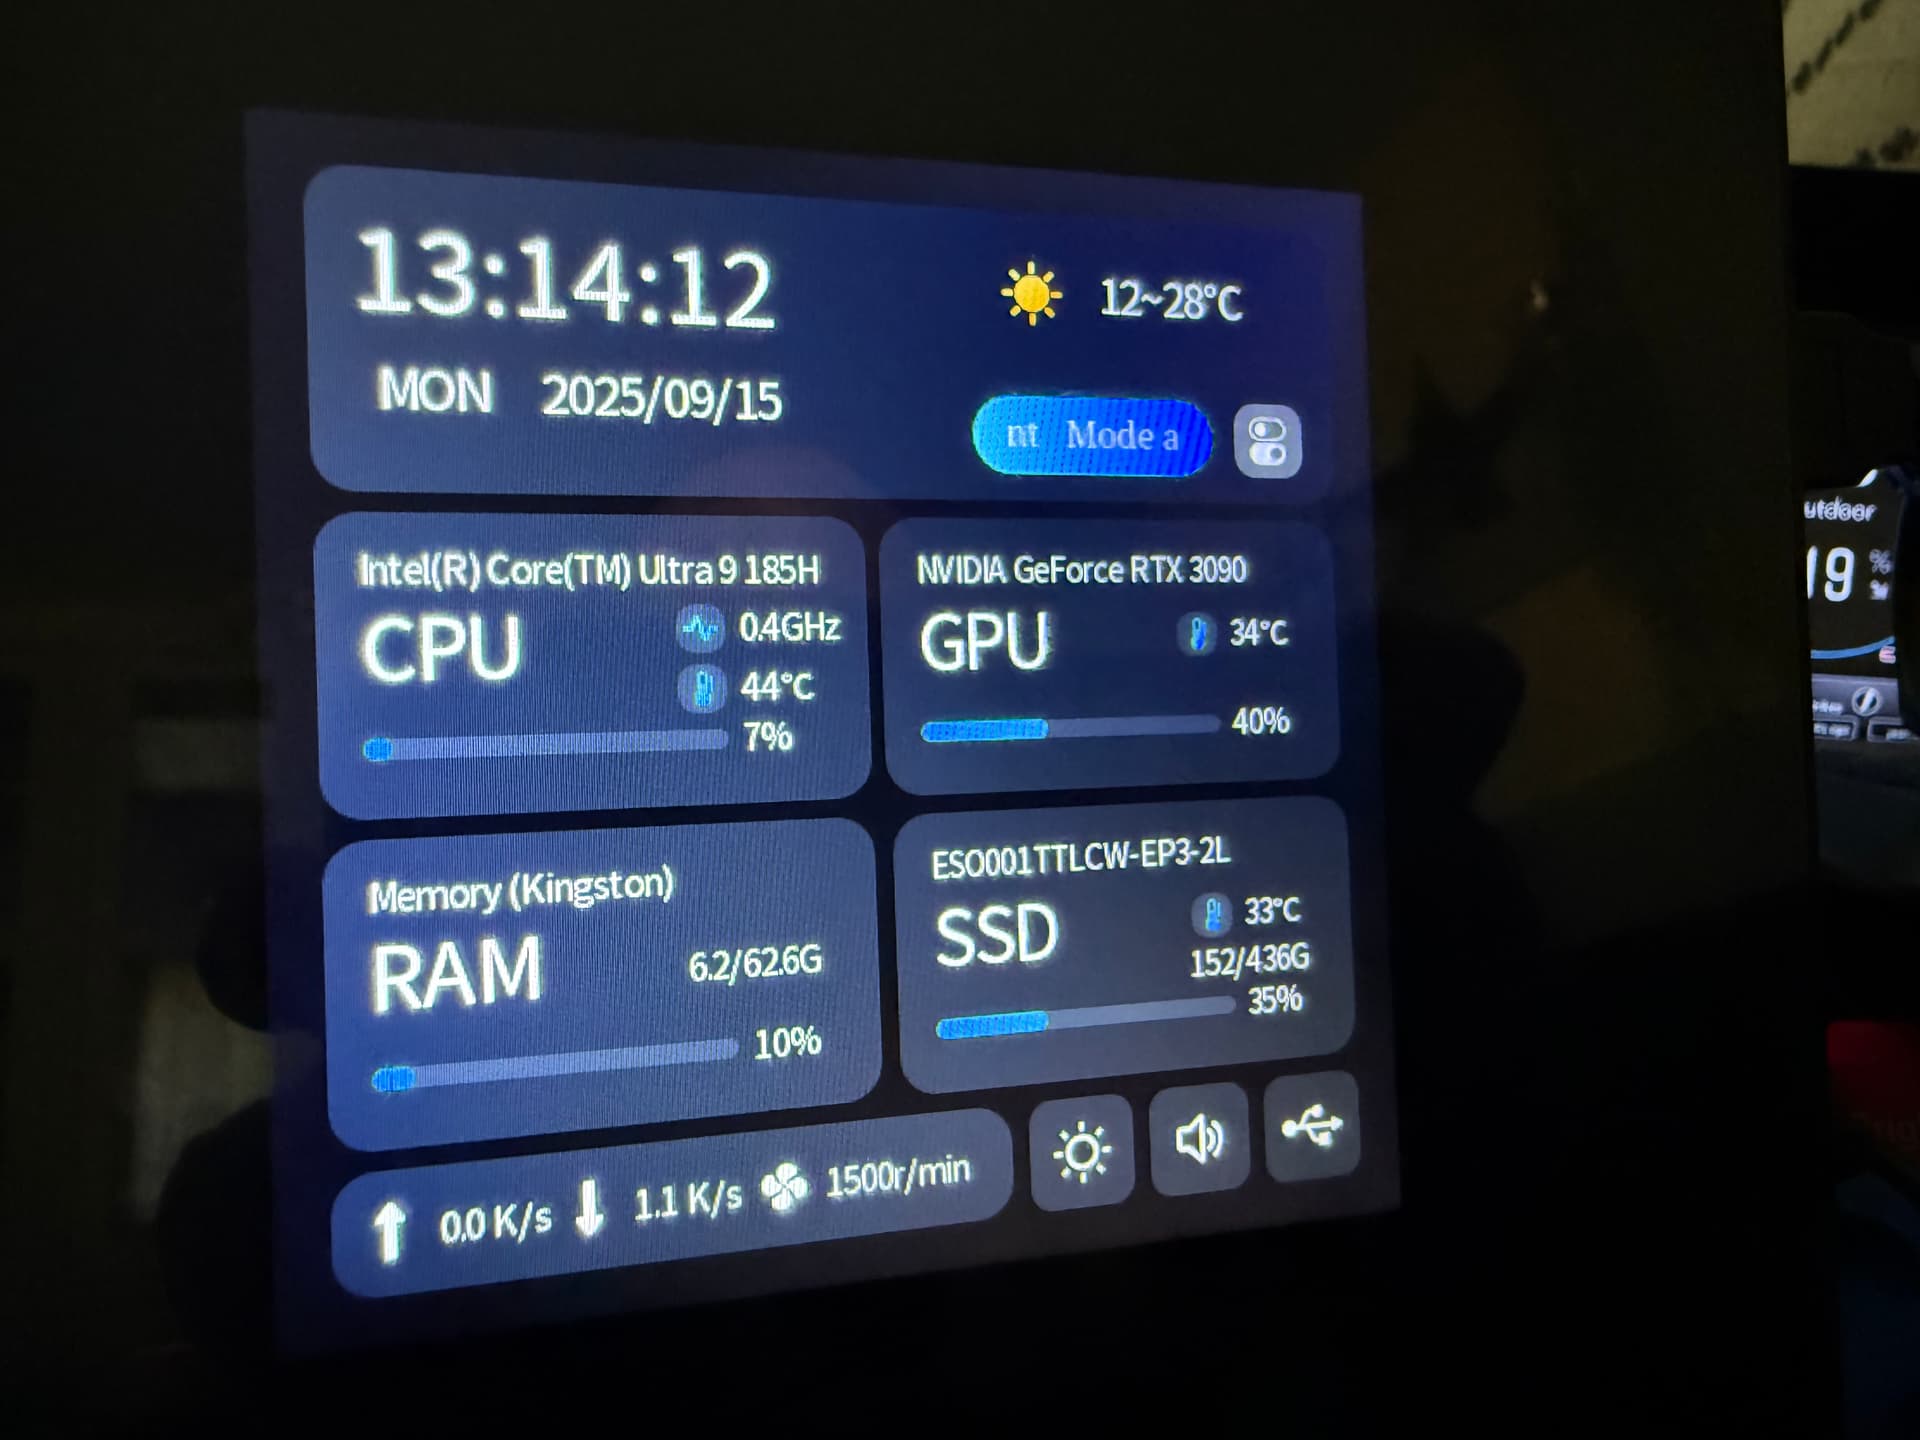
One quirk: the protocol has fields for Zone and Desc. You can happily send them, but the panel firmware never renders them. They are “dead fields.” That’s why you’ll only ever see the icon and the high/low temperatures on the panel itself. For clarity, though, the dashboard shows the full weather info, including zone and description.
What It Looks Like
Here’s the dashboard output running on my box:
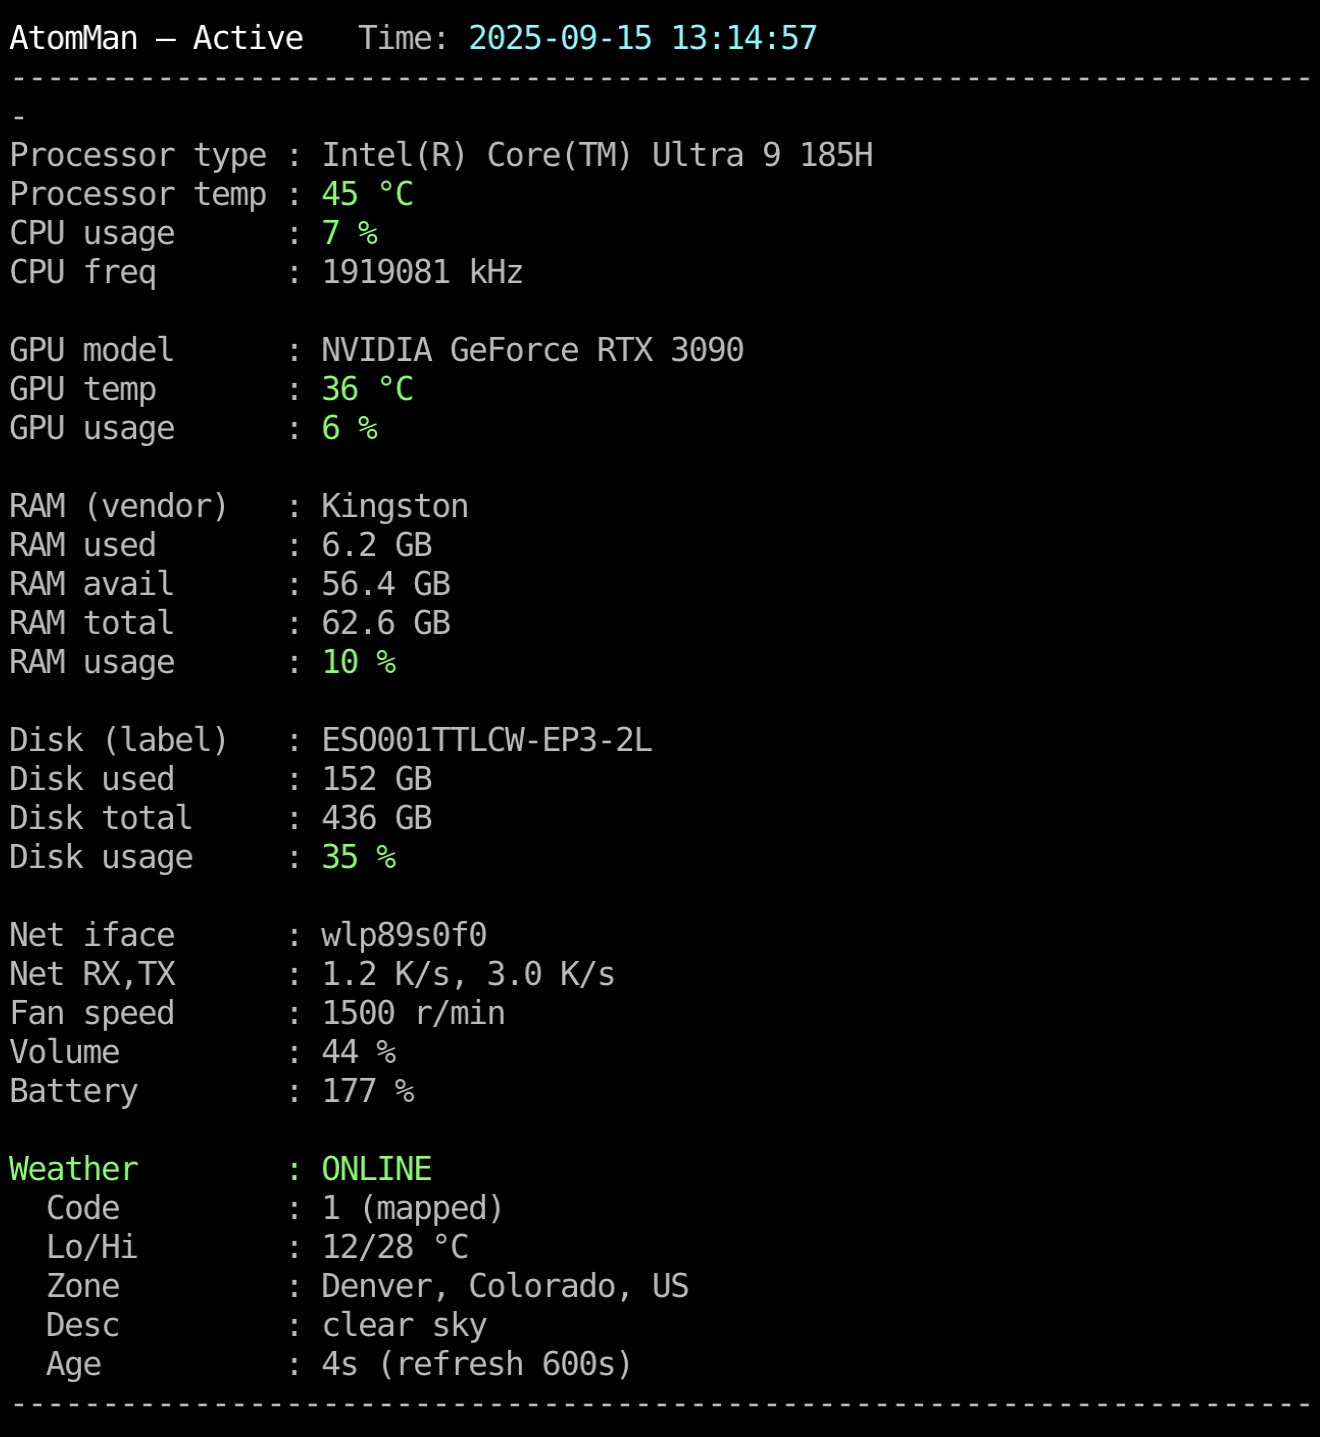
AtomMan — Active   Time: 2025-09-15 13:14:57
----------------------------------------------------------------
Processor type : Intel(R) Core(TM) Ultra 9 185H
Processor temp : 45 °C
CPU usage      : 7 %
CPU freq       : 1919081 kHz

GPU model      : NVIDIA GeForce RTX 3090
GPU temp       : 36 °C
GPU usage      : 6 %

RAM (vendor)   : Kingston
RAM used       : 6.2 GB
RAM avail      : 56.4 GB
RAM total      : 62.6 GB
RAM usage      : 10 %

Disk (label)   : ESO0001TTLCW-EP3-2L
Disk used      : 152 GB
Disk total     : 436 GB
Disk usage     : 35 %

Net iface      : wlp89s0f0
Net RX,TX      : 1.2 K/s, 3.0 K/s
Fan speed      : 1500 r/min
Volume         : 44 %
Battery        : 177 %

Weather        : ONLINE
Code           : 1 (mapped)
Lo/Hi          : 12/28 °C
Zone           : Denver, Colorado, US
Desc           : clear sky
Age            : 4s (refresh 600s)
----------------------------------------------------------------
The panel itself shows the icon and the temperatures, while the console view gives you the full context.
Running It
It’s just Python. You need pyserial and some common Linux tools (dmidecode, lshw, pciutils). Drop the script somewhere, run it with:
python3 screen.py --dashboard
Or set it up as a systemd service so it runs at boot. A sample unit file is in the docs.
Takeaways
- The AtomMan display is a neat little gadget, but the vendor never provided Linux support.
- With
screen.py, you can finally use it on Linux. - Weather support works via OpenWeather, with a translation layer to panel icon codes.
- Zone and Desc fields don’t render on the screen, so don’t expect them to.
- Everything else—CPU, GPU, memory, disk, fan, net—works as expected.